


Fig. 4.
Download original image
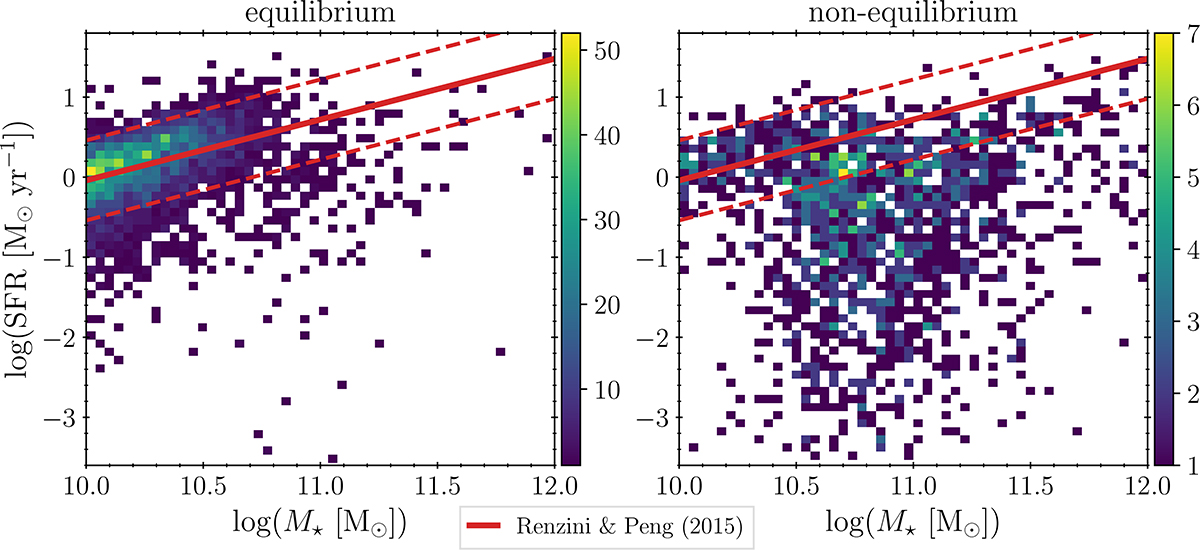
SFR as a function of stellar mass for equilibrium (left) and non-equilibrium (right) galaxies. The solid red line indicates the SFMS from Renzini & Peng (2015), with dashed lines showing the adopted scatter. Colour maps indicate the number of galaxies per bin in each panel; note that the colour scales differ between the equilibrium and non-equilibrium panels, reflecting the different sample sizes.
Current usage metrics show cumulative count of Article Views (full-text article views including HTML views, PDF and ePub downloads, according to the available data) and Abstracts Views on Vision4Press platform.
Data correspond to usage on the plateform after 2015. The current usage metrics is available 48-96 hours after online publication and is updated daily on week days.
Initial download of the metrics may take a while.