


Fig. 3.
Download original image
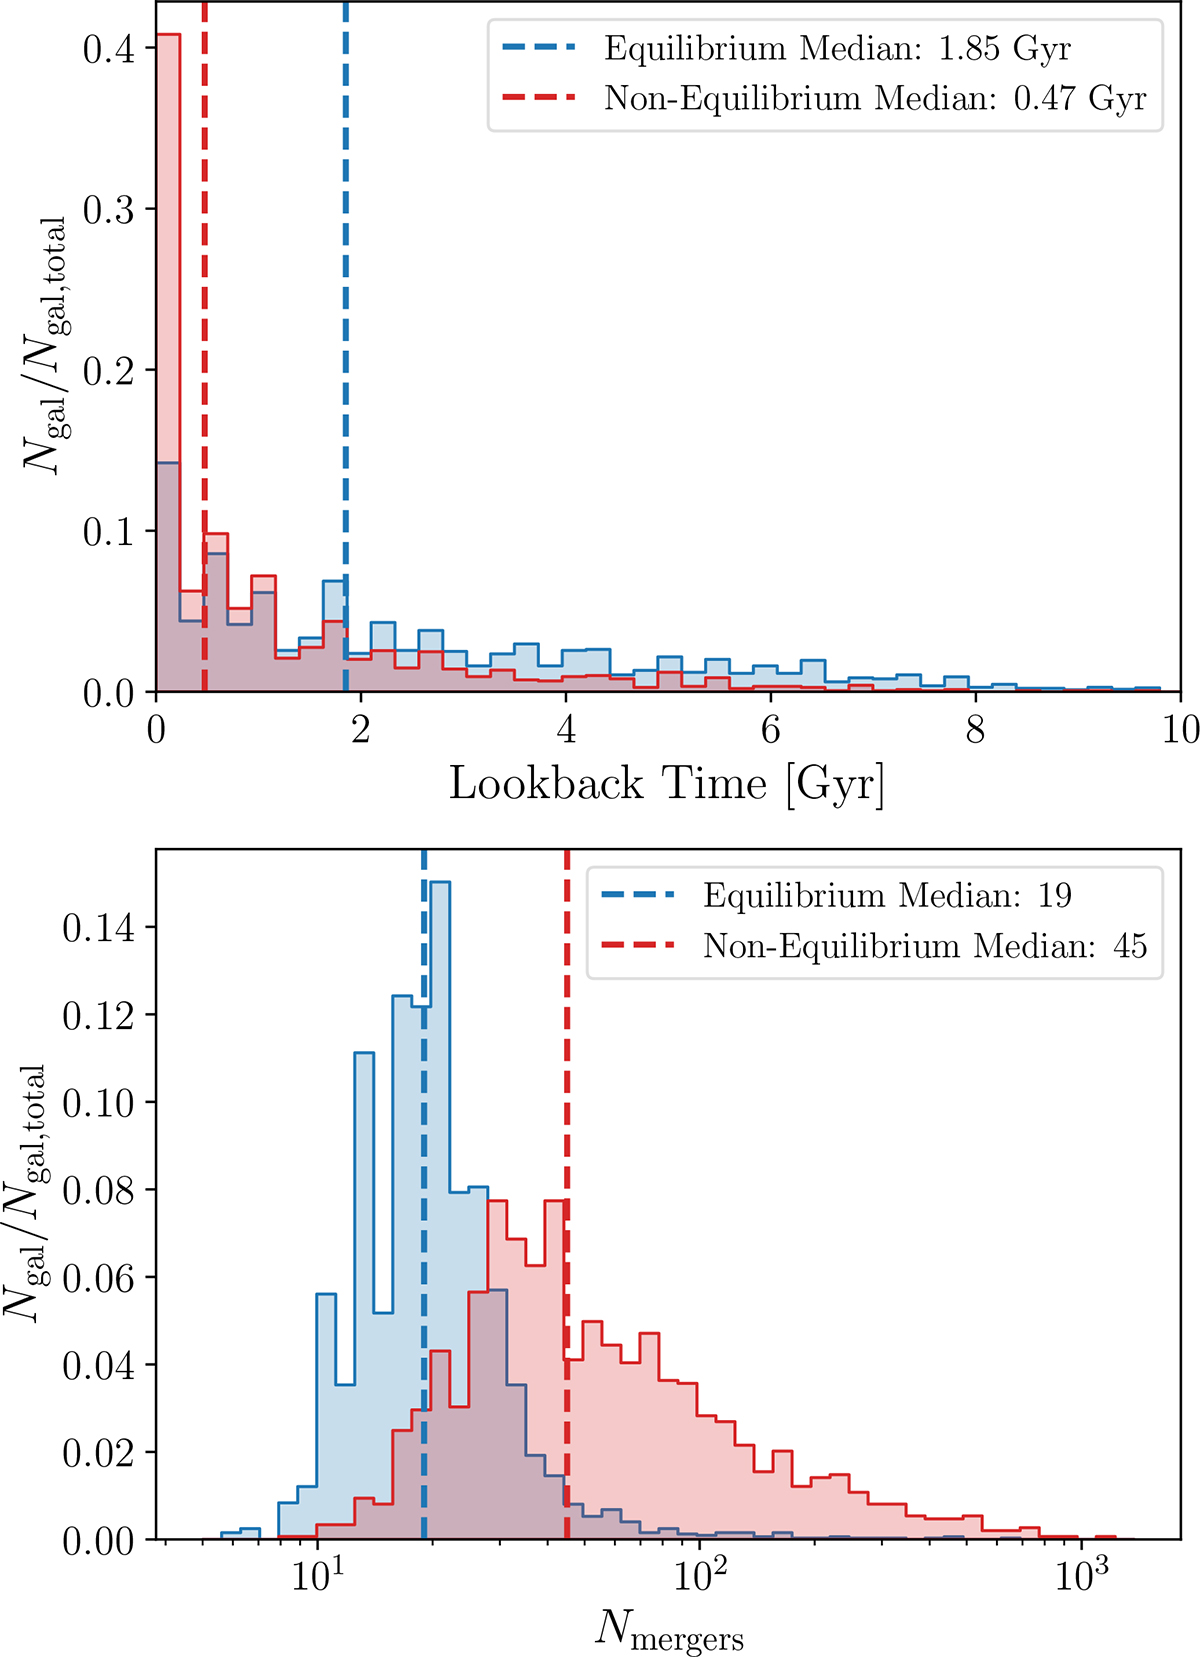
Merger statistics for the equilibrium (blue) and non-equilibrium (red) galaxy populations, normalised by the total number of galaxies in each population. Top panel: Distribution of lookback times to the most recent merger event of any stellar mass ratio, as recorded in the supplementary merger history catalogue (Rodriguez-Gomez et al. 2017; Eisert et al. 2023). Bottom panel: Distribution of the total number of mergers experienced over the full assembly history of each galaxy. In both panels, vertical dashed lines indicate the median values for each population, with exact values given in the legends.
Current usage metrics show cumulative count of Article Views (full-text article views including HTML views, PDF and ePub downloads, according to the available data) and Abstracts Views on Vision4Press platform.
Data correspond to usage on the plateform after 2015. The current usage metrics is available 48-96 hours after online publication and is updated daily on week days.
Initial download of the metrics may take a while.