


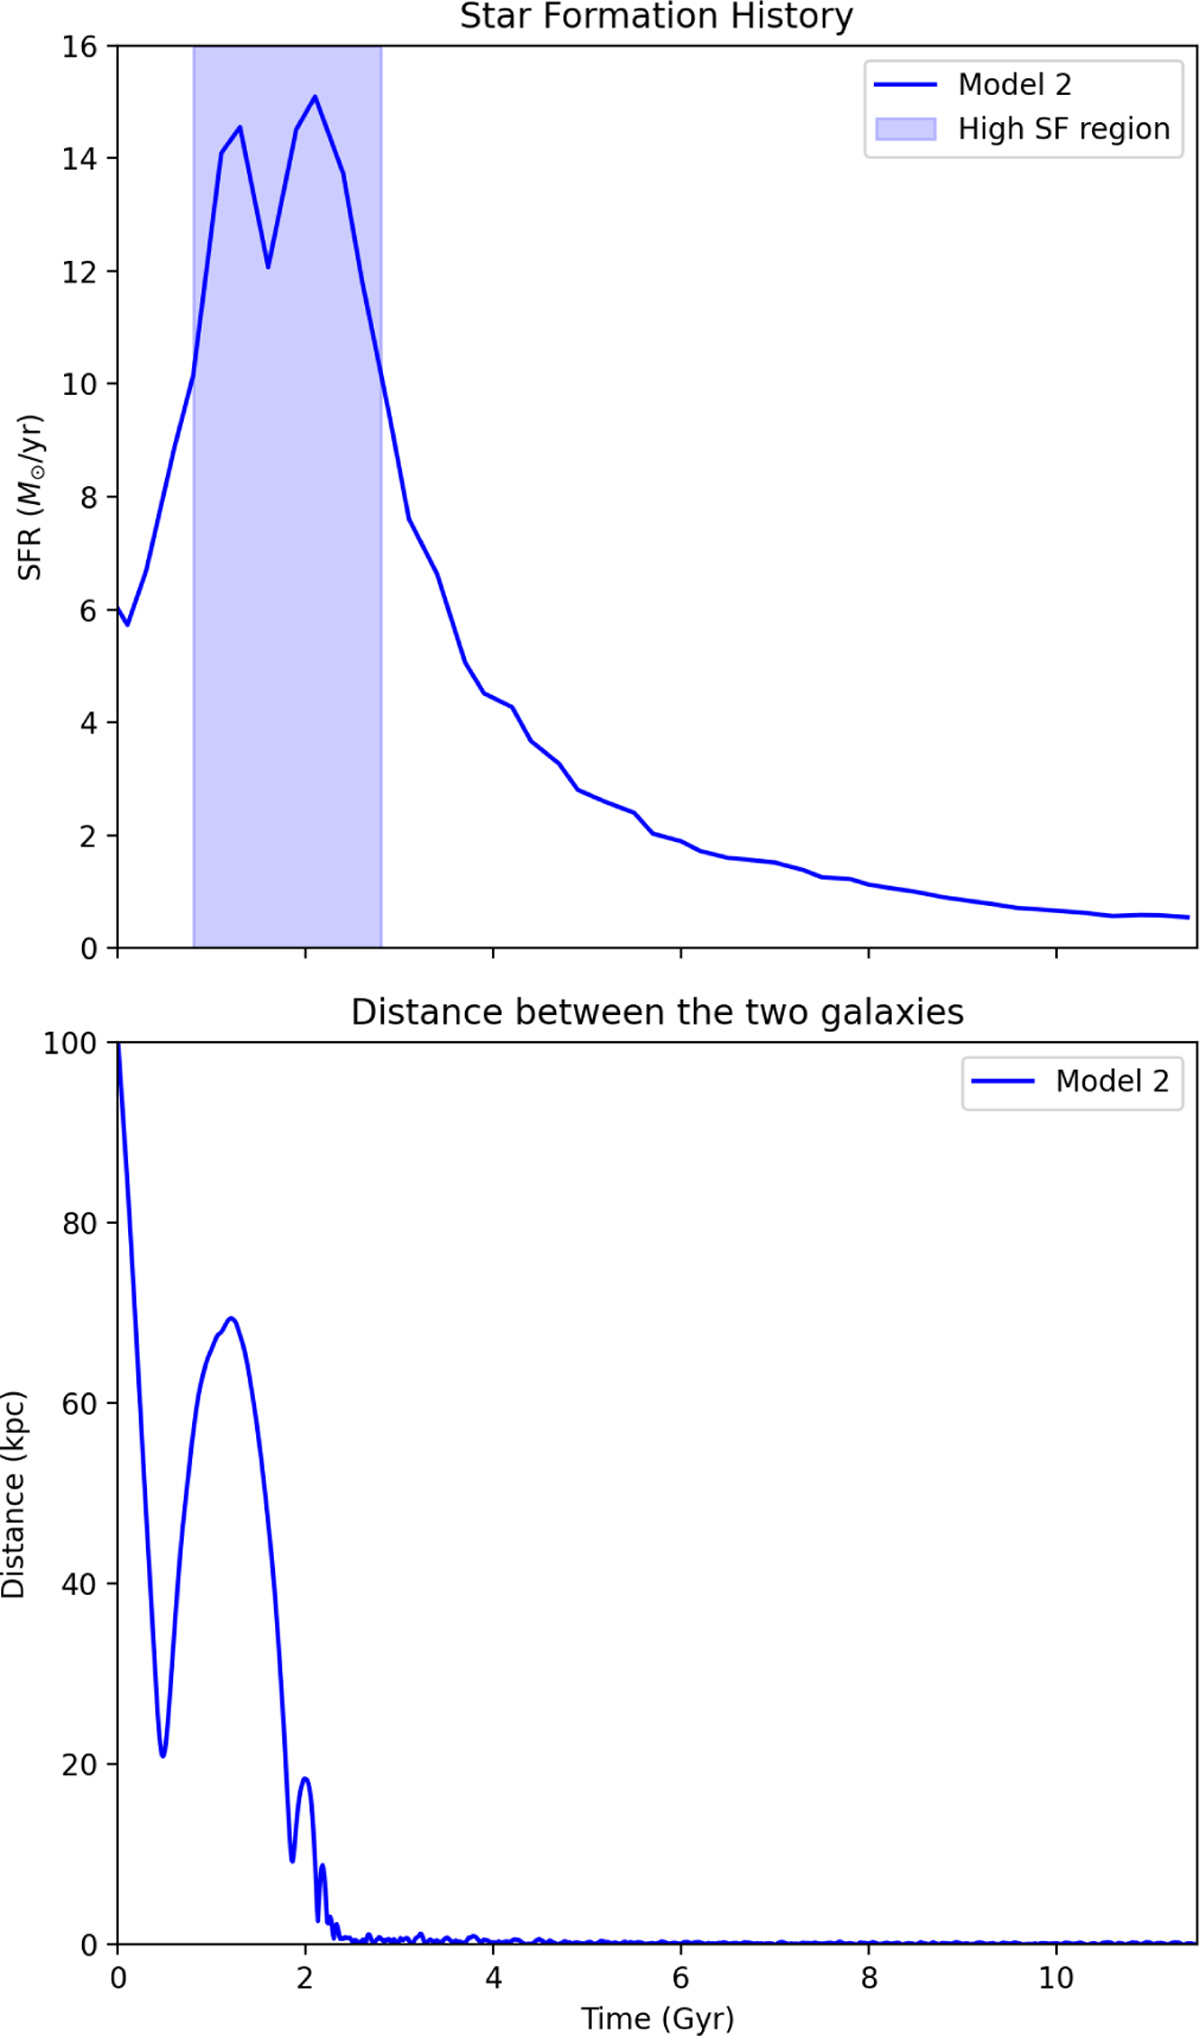
Fig. B.3
Download original image
Top panel: Star formation rate as a function of time for Model 2. The shaded region (spanning approximately 2 Gyr) highlights the enhanced star formation associated with the merger. The Merger GCs correspond to stellar particles formed during this epoch. Bottom panel: Distance between the cores of the primary (MW) and secondary (GSE) galaxies as a function of time.
Current usage metrics show cumulative count of Article Views (full-text article views including HTML views, PDF and ePub downloads, according to the available data) and Abstracts Views on Vision4Press platform.
Data correspond to usage on the plateform after 2015. The current usage metrics is available 48-96 hours after online publication and is updated daily on week days.
Initial download of the metrics may take a while.