


Fig. 2
Download original image
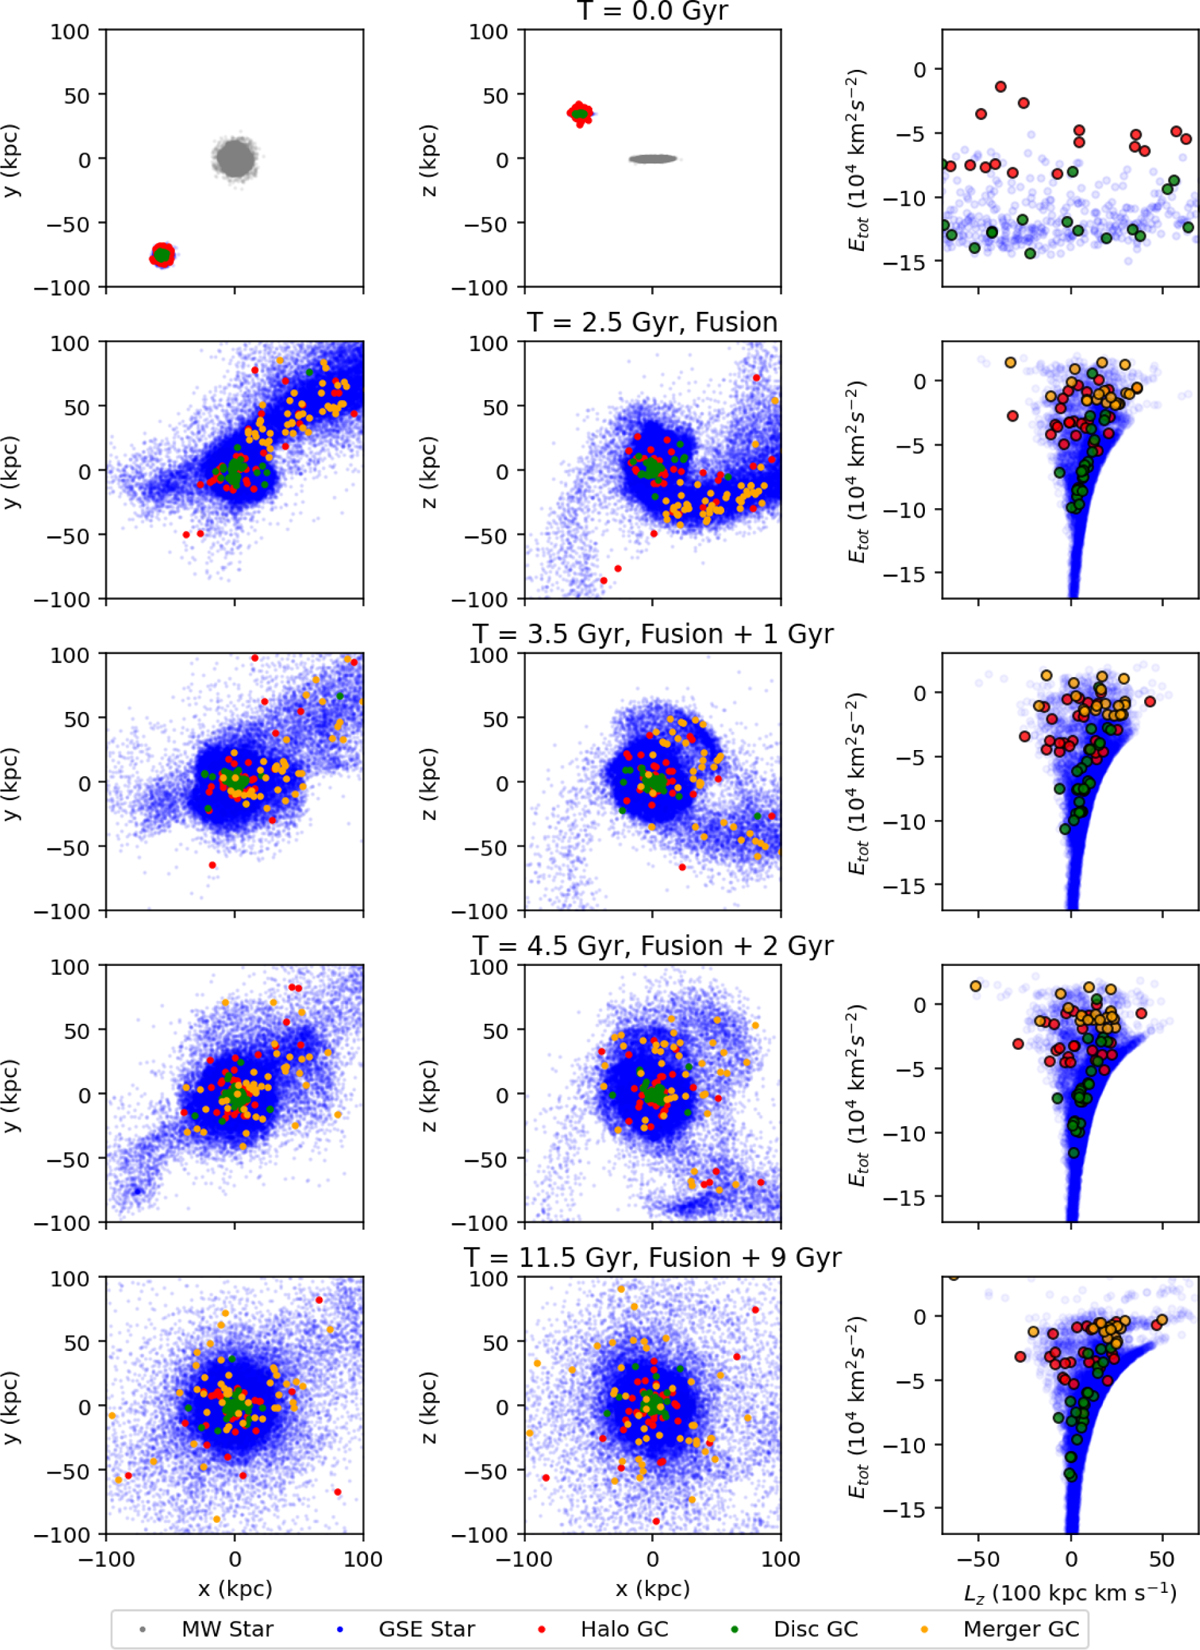
Time evolution of the merger process for Model 2. Left, middle columns: Projections of the simulated GC positions onto the x - y and x - z planes. The z-axis is aligned with the direction of angular momentum at each epoch. The MW stars are shown in grey, and GSE stars are in blue. The GCs originally associated with the GSE disc are shown in green, and those originating in the GSE halo are shown in red. The Merger GCs formed from GSE gas in the tidal tail during the merger and are shown in orange. Right column: Distributions of GSE stars and GCs in the E - Lz space at the corresponding times.
Current usage metrics show cumulative count of Article Views (full-text article views including HTML views, PDF and ePub downloads, according to the available data) and Abstracts Views on Vision4Press platform.
Data correspond to usage on the plateform after 2015. The current usage metrics is available 48-96 hours after online publication and is updated daily on week days.
Initial download of the metrics may take a while.