


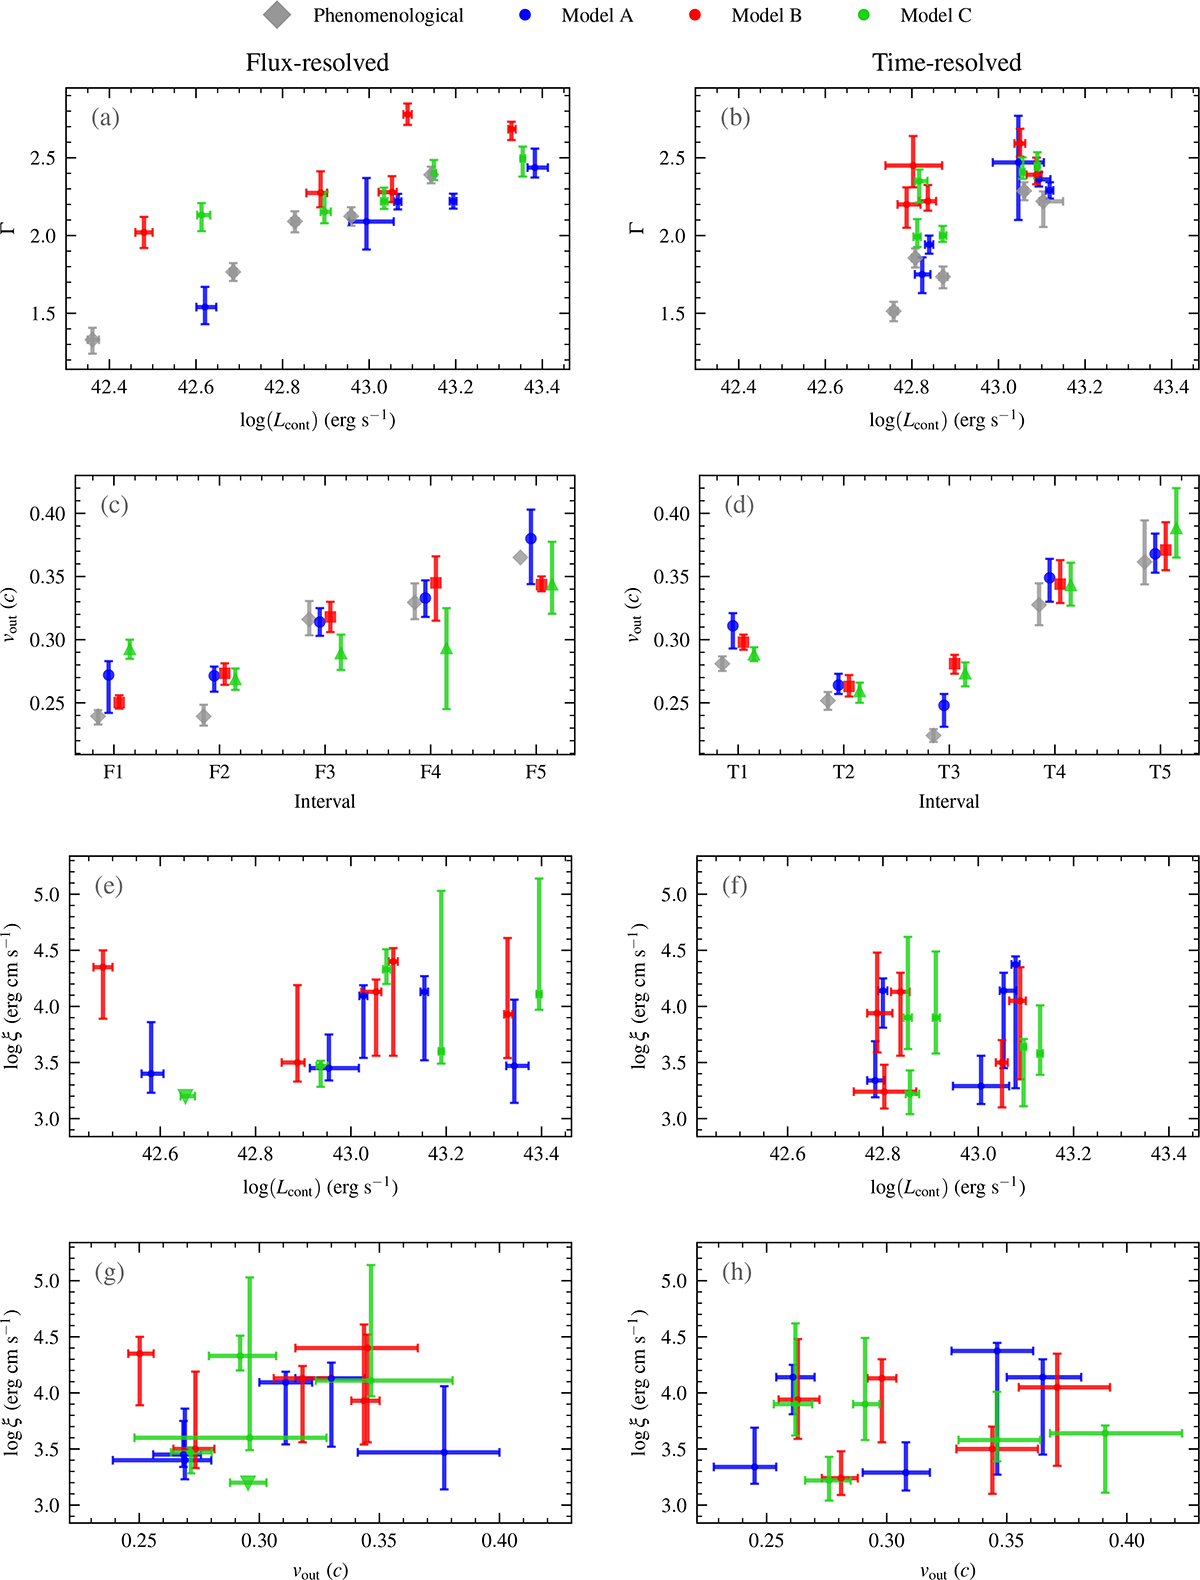
Fig. D.3.
Download original image
Visualization of the key findings in the flux- and time-resolved analysis. Missing values are reported as × and upper–lower limits as triangles. Panels c) and d) show the outflow velocities per each flux- and time-resolved spectrum, respectively showing clearly the consistency of vout across the models. For better visibility, values from each model are offset by a small amount in the x-axis.
Current usage metrics show cumulative count of Article Views (full-text article views including HTML views, PDF and ePub downloads, according to the available data) and Abstracts Views on Vision4Press platform.
Data correspond to usage on the plateform after 2015. The current usage metrics is available 48-96 hours after online publication and is updated daily on week days.
Initial download of the metrics may take a while.