


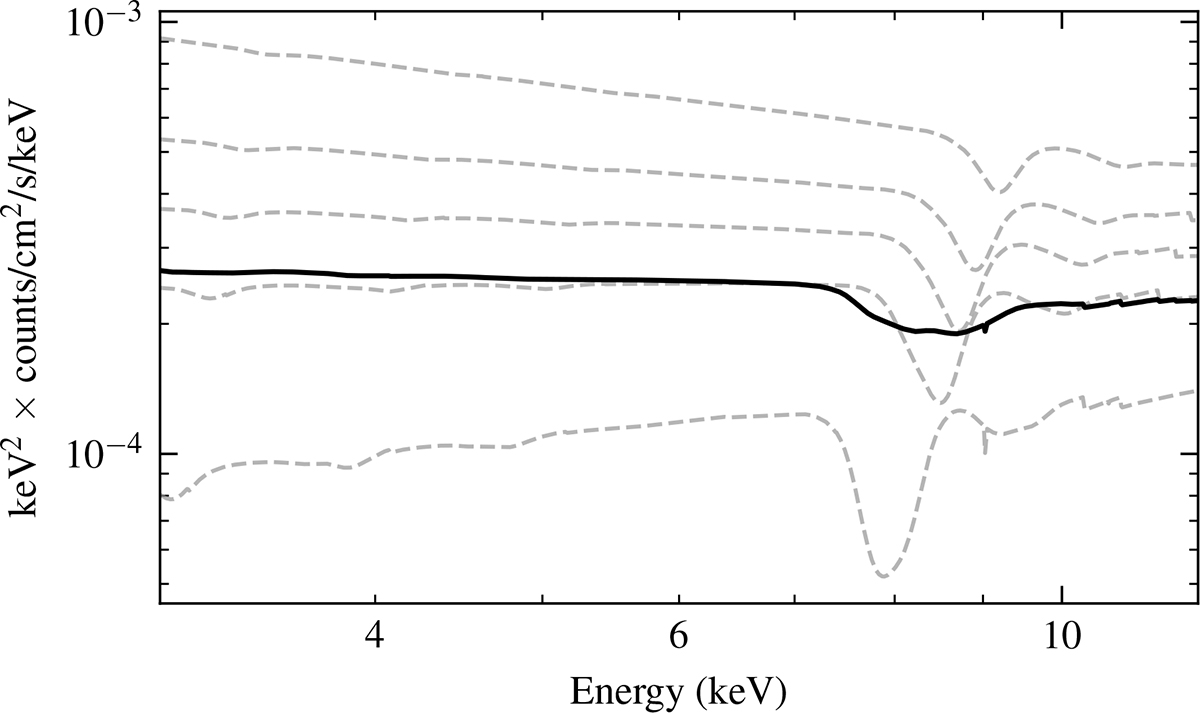
Fig. D.2.
Download original image
Simulated average spectrum obtained by stacking synthetic spectra generated for each flux-resolved interval, incorporating observed trends in continuum slope, outflow velocity and the tentative ones in ionization and column density. The resulting stacked spectrum (black) is compared to absorbed power laws for each simulated flux interval (dashed gray). The absence of significant emission features in the stacked spectrum indicates that the emission observed in the actual average spectrum is unlikely to be an artifact of stacking variable flat spectra.
Current usage metrics show cumulative count of Article Views (full-text article views including HTML views, PDF and ePub downloads, according to the available data) and Abstracts Views on Vision4Press platform.
Data correspond to usage on the plateform after 2015. The current usage metrics is available 48-96 hours after online publication and is updated daily on week days.
Initial download of the metrics may take a while.