


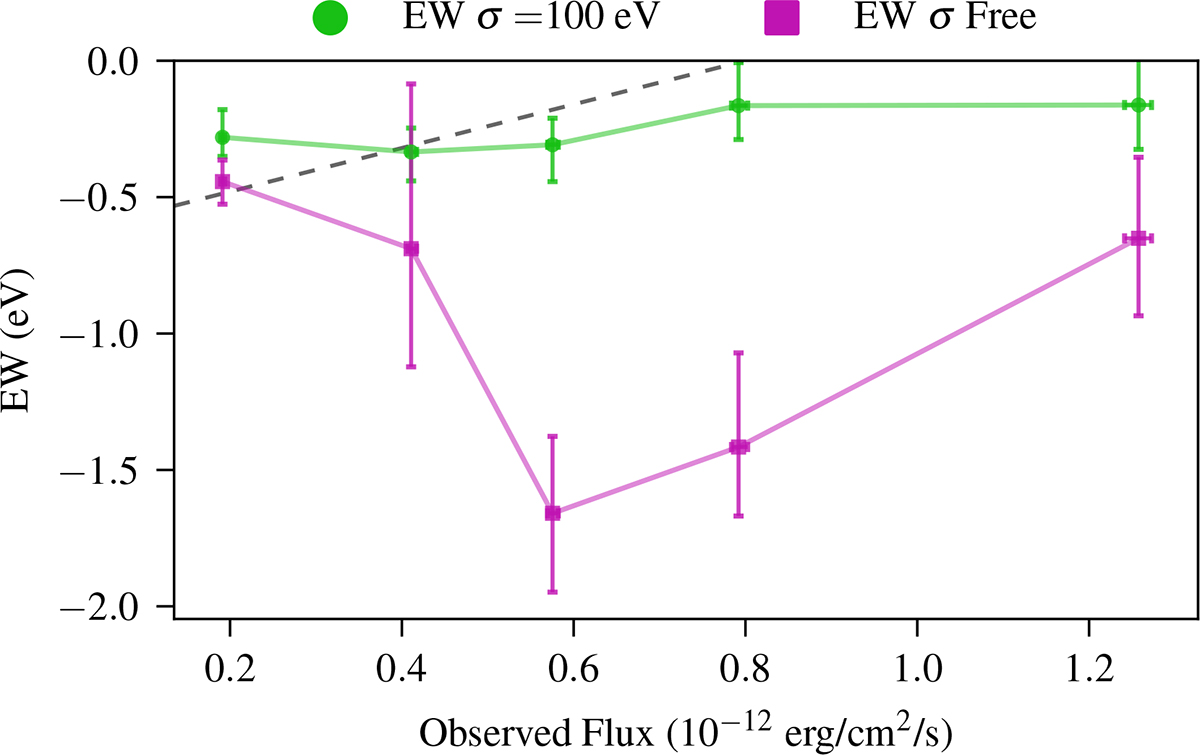
Fig. D.1.
Download original image
EW of the UFO as a function of the 3-10 keV observed flux for the time-resolved spectra (T1-T5) of IRAS 13224-3809. The lack of correlation between the two quantities is directly visualized here, in contrast to the work of Parker et al. (2017), Pinto et al. (2018). The dashed line represents the best-fit anticorrelation reported in Parker et al. (2017) for comparison.
Current usage metrics show cumulative count of Article Views (full-text article views including HTML views, PDF and ePub downloads, according to the available data) and Abstracts Views on Vision4Press platform.
Data correspond to usage on the plateform after 2015. The current usage metrics is available 48-96 hours after online publication and is updated daily on week days.
Initial download of the metrics may take a while.