


Fig. B.1.
Download original image
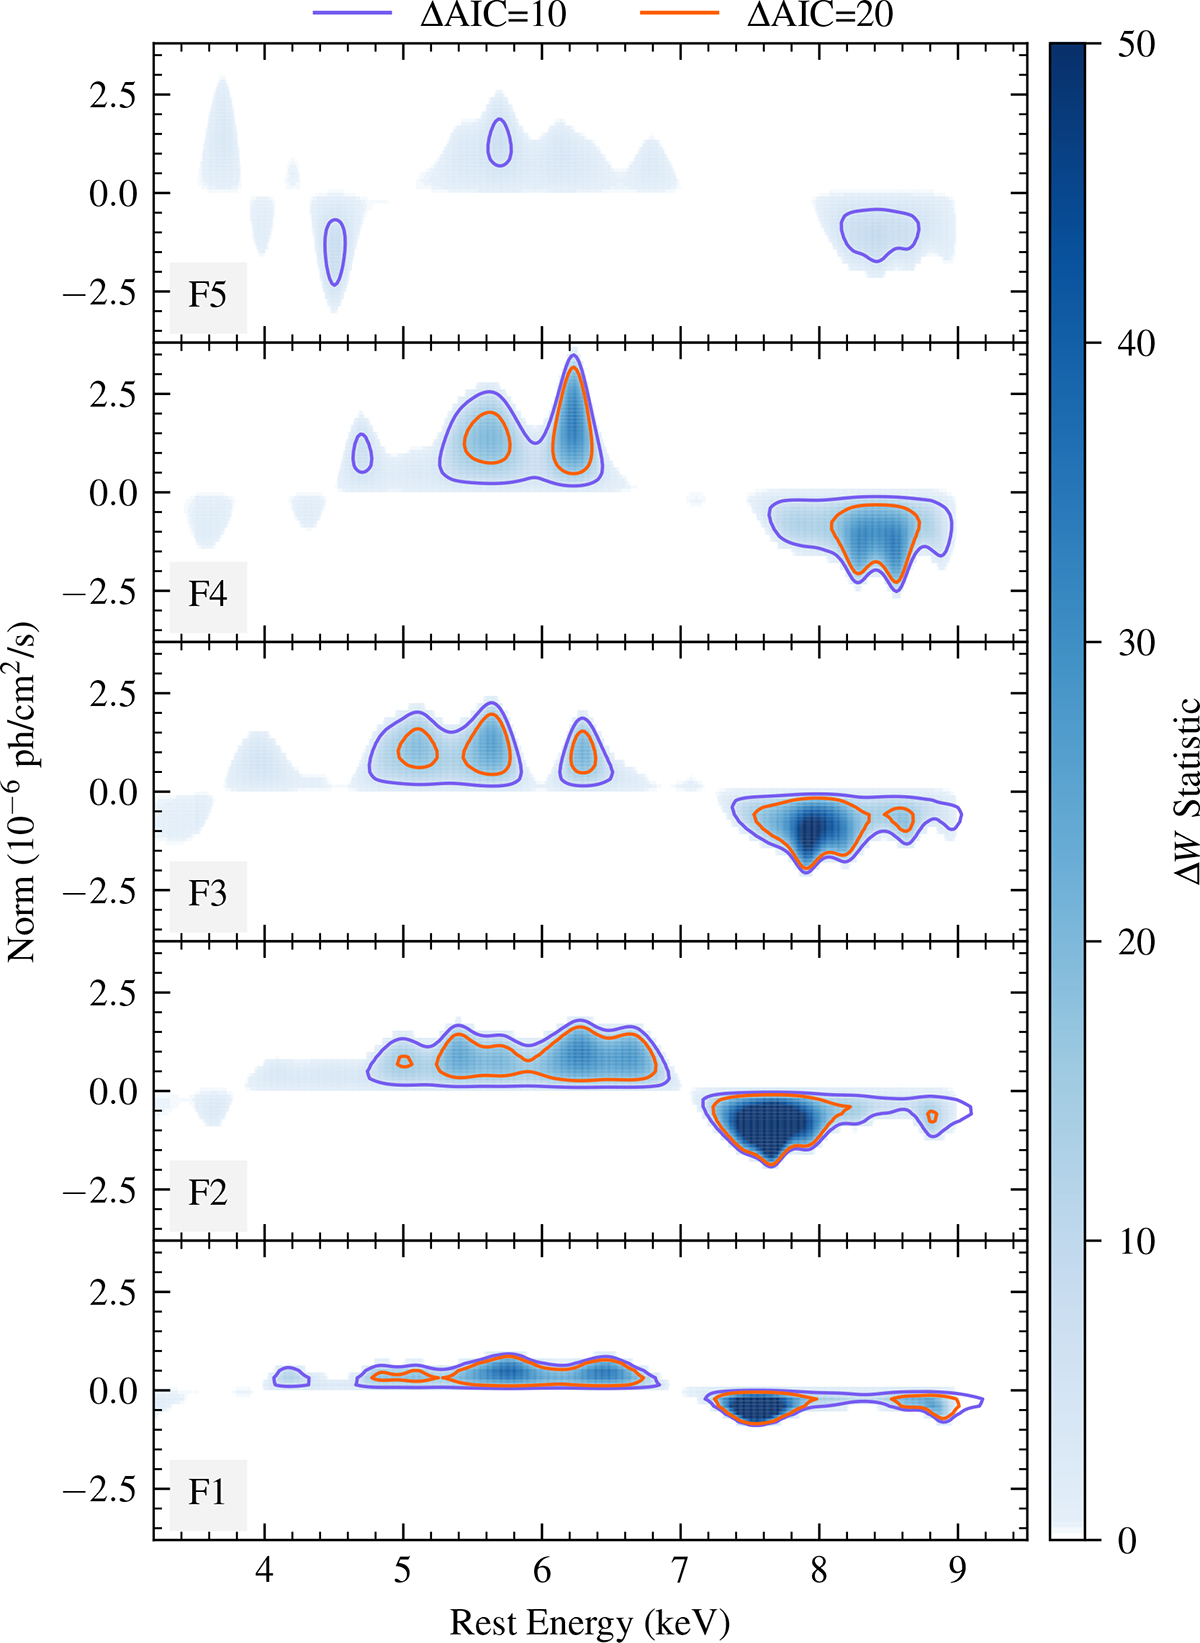
Gaussian line scans performed on the flux-resolved spectra of IRAS 13224–3809 in the 3–10 keV range in the source rest frame. The line width is fixed to σline = 100 eV, and the ordinate axis shows the best-fitting line normalization, with negative values indicating absorption features. The colored contours indicate thresholds in ΔAIC relative to strong and very strong evidence for the inclusion of an additional line, corresponding to ΔAIC = 10 (purple) and ΔAIC = 20 (orange), respectively. These conservative ΔAIC thresholds are adopted to robustly highlight only the most significant structures; the same regions are also recovered when using likelihood-based Δχ2 (ΔW) contours commonly adopted in previous analyses.
Current usage metrics show cumulative count of Article Views (full-text article views including HTML views, PDF and ePub downloads, according to the available data) and Abstracts Views on Vision4Press platform.
Data correspond to usage on the plateform after 2015. The current usage metrics is available 48-96 hours after online publication and is updated daily on week days.
Initial download of the metrics may take a while.