


Fig. 8
Download original image
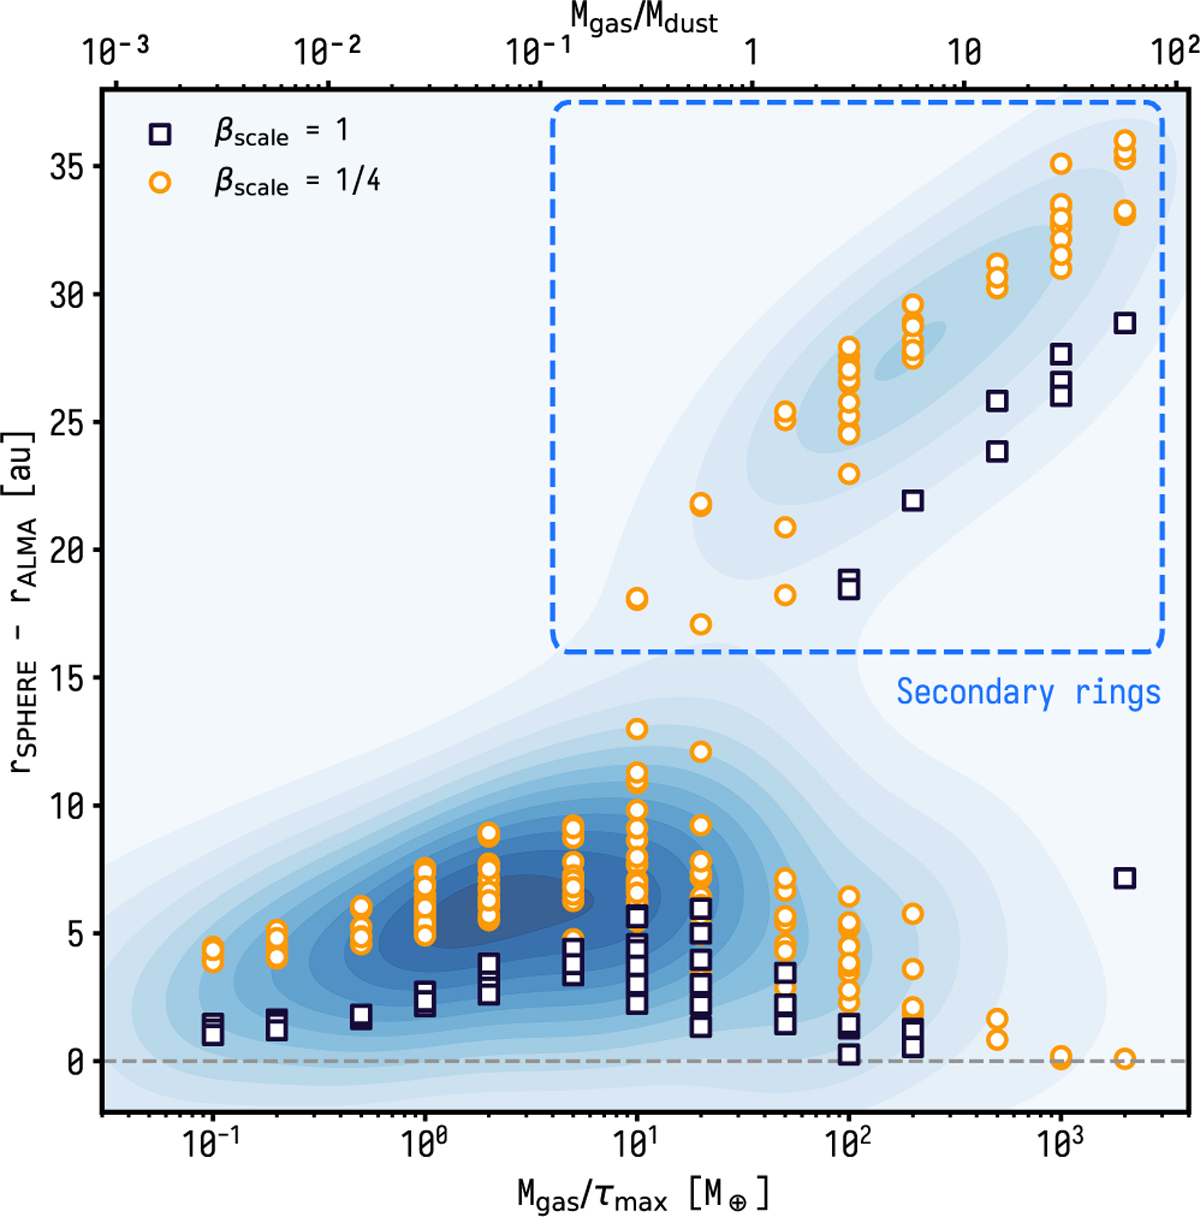
Offset between SPHERE and ALMA as a function of the ratio between the gas mass Mgas and maximum optical depth τmax for all models from families F1 to F8 (i.e., all but F9). Models with different βscale are shown with different symbols and colors. The dashed blue box shows the locus of models whose secondary belt is brighter than the birth ring in the SPHERE radial profiles. The underlying contours show a 2D KDE for all the models. A secondary x-axis at the top shows the estimated gas to dust mass ratio.
Current usage metrics show cumulative count of Article Views (full-text article views including HTML views, PDF and ePub downloads, according to the available data) and Abstracts Views on Vision4Press platform.
Data correspond to usage on the plateform after 2015. The current usage metrics is available 48-96 hours after online publication and is updated daily on week days.
Initial download of the metrics may take a while.