


Fig. 5.
Download original image
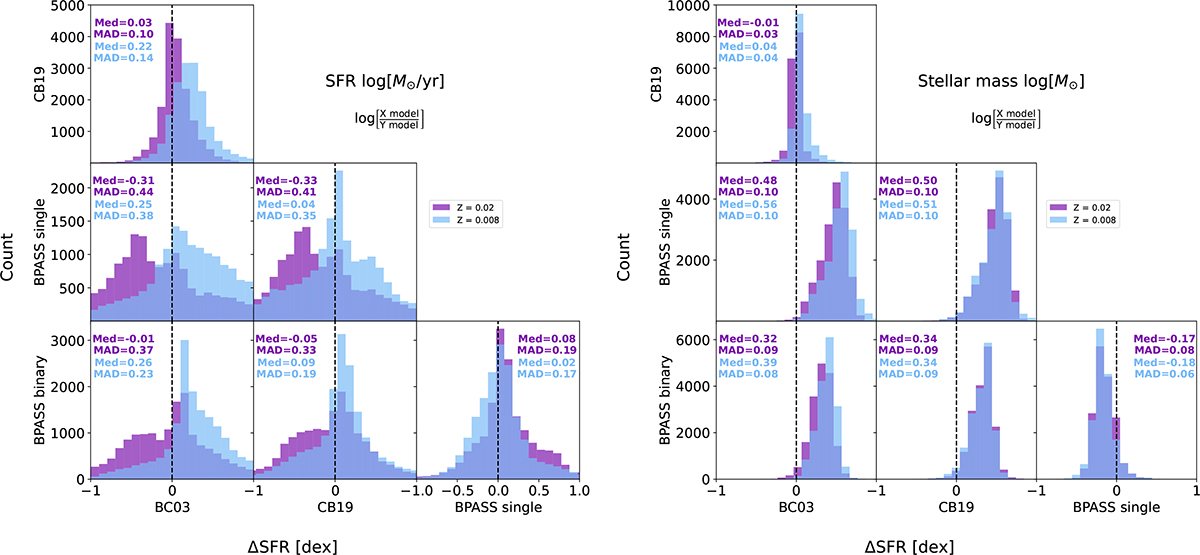
Histograms of the offsets in dex between the physical properties (left: SFR, right: M★) determined by the model on the y-axis label and the model on the x-axis label inferred from the fits on the observed fluxes. The order of the plots follows Fig. 3. The dashed line shows the location of 0.0 dex offset. The blue histograms are for Z = 0.008 and the purple for Z = 0.02. Every plot shows the respective median and median absolute deviation of the offset.
Current usage metrics show cumulative count of Article Views (full-text article views including HTML views, PDF and ePub downloads, according to the available data) and Abstracts Views on Vision4Press platform.
Data correspond to usage on the plateform after 2015. The current usage metrics is available 48-96 hours after online publication and is updated daily on week days.
Initial download of the metrics may take a while.