


Fig. 4.
Download original image
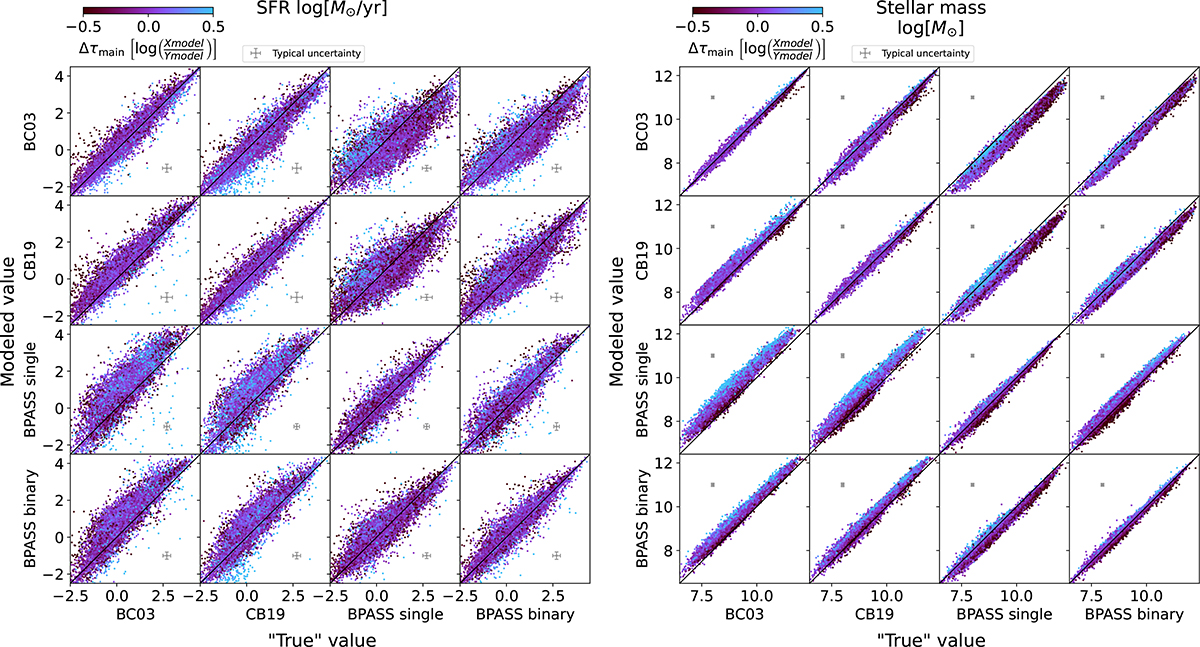
Comparison of the “true” (x-axis) to the estimated (y-axis) SFR (left) and M★ (right) for the galaxies in the synthetic catalog for every stellar population. The median relative uncertainty of the sample is shown in the top left of each plot. The solid black lines correspond to a one-to-one relation. These results were obtained using the parameters shown in Table C.1. These plots show the results for Z = 0.008. Similar plots for Z = 0.02 are shown in Figure B.2.
Current usage metrics show cumulative count of Article Views (full-text article views including HTML views, PDF and ePub downloads, according to the available data) and Abstracts Views on Vision4Press platform.
Data correspond to usage on the plateform after 2015. The current usage metrics is available 48-96 hours after online publication and is updated daily on week days.
Initial download of the metrics may take a while.