


Fig. 7
Download original image
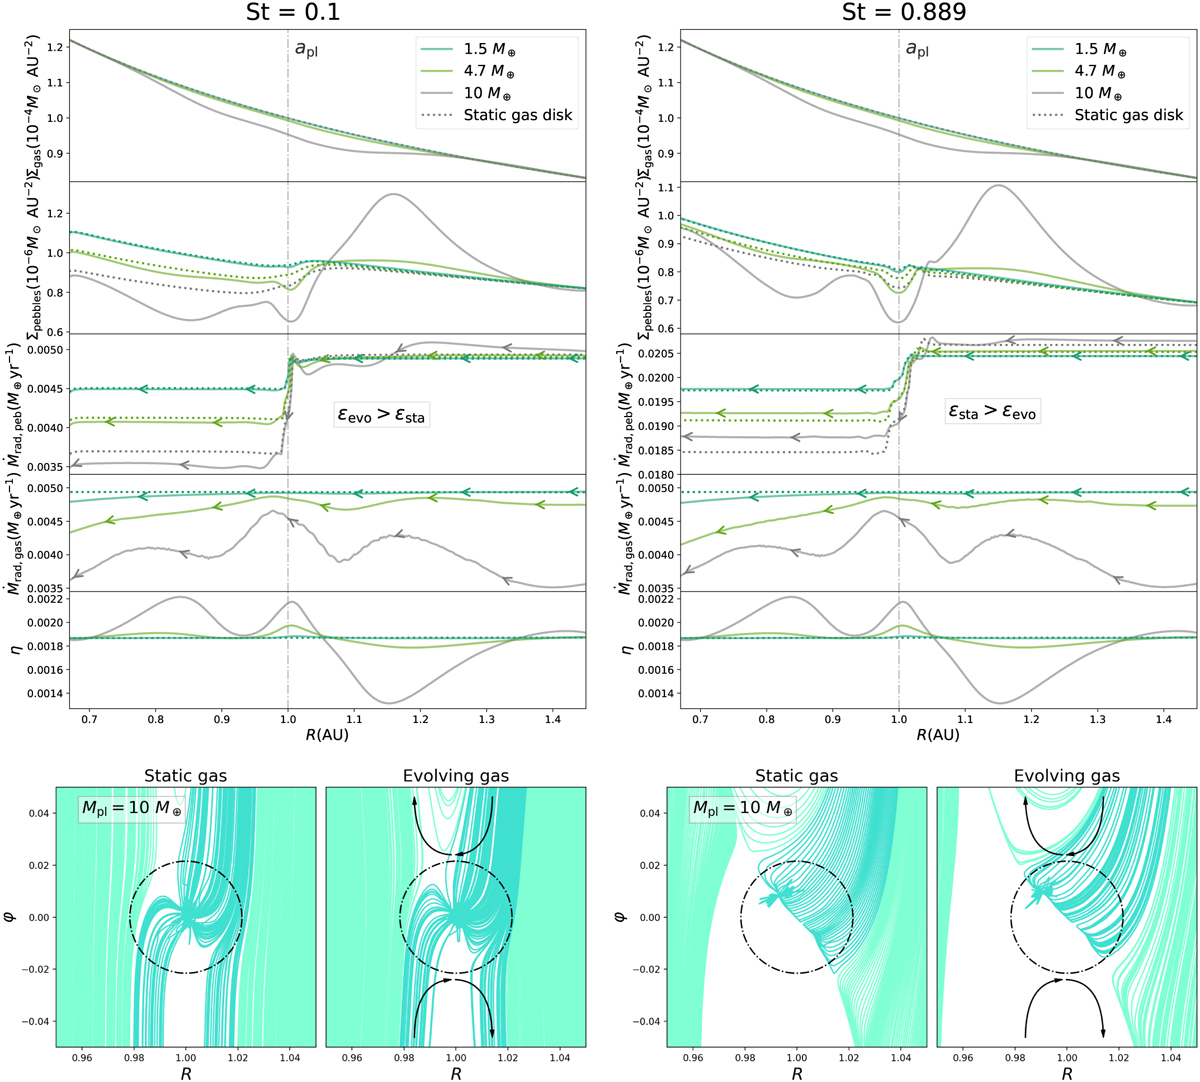
Two monodisperse setups for St = 0.1 (left) and St = 0.889 (right). Top five rows: Three different planet masses (1.5, 4.7, and 10 M⊕), denoted by colour. The dotted lines signify a static (as opposed to evolving) gas disc. The planet is situated at apl = 1 AU. Back-reaction is disabled for these results. First row : azimuthally averaged gas surface density. Second row : azimuthally averaged pebble surface density. Third row : total radial pebble mass flow, as described in Eq. (17). Fourth row : total radial gas flow. Fifth row : dimensionless η-parameter relating vg,φ and vκ, as in Eqs. (8) and (9). Bottom plots : pebble streamlines for a static (left), and an evolving disc (right) for a 10 M⊕ planet. These pebble lines are indicated by the grey lines in the azimuthally averaged and/or summed graphs above. The dash-dotted circle indicates the Hill sphere. The arrows on the right plots illustrating the evolving gas disc signify the direction of the horseshoe orbits. Pebble streamlines arise in the outer disc, with the darker ones accreting onto the planet. The accreting fraction for an evolving gas disc is higher by approximately 16% for St = 0.1 and lower by approximately 12% for St = 0.889.
Current usage metrics show cumulative count of Article Views (full-text article views including HTML views, PDF and ePub downloads, according to the available data) and Abstracts Views on Vision4Press platform.
Data correspond to usage on the plateform after 2015. The current usage metrics is available 48-96 hours after online publication and is updated daily on week days.
Initial download of the metrics may take a while.