


Fig. 10
Download original image
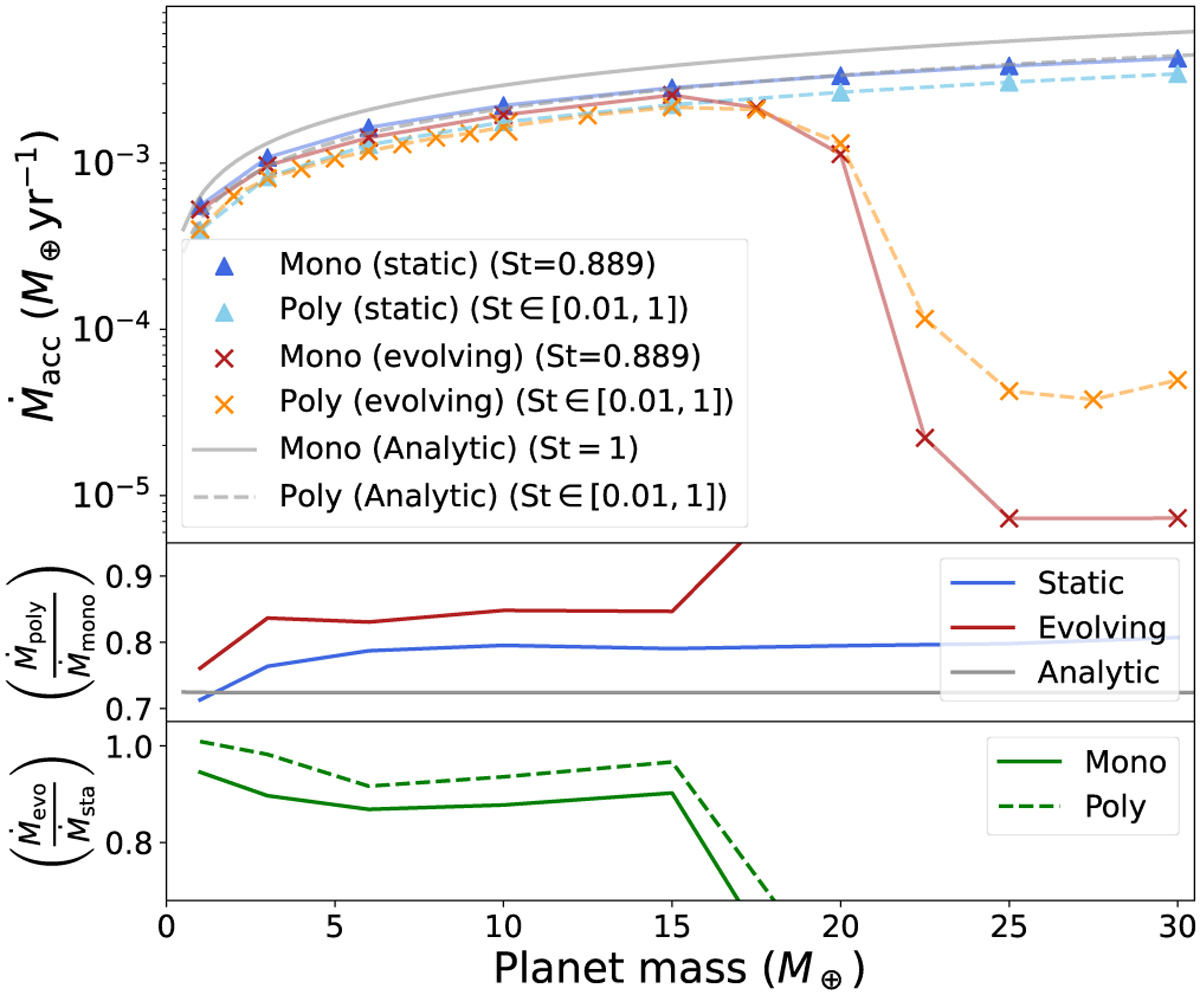
Pebble accretion rates and relative accretion ratios as a function of planet mass. Top panel : mass accretion rate Macc for different scenarios. The blue triangles and lines represent a static gas disc, while the red and orange crosses and lines indicate the evolving gas disc. The grey lines denote our analytical results, and the solid lines denote the monodisperse populations (St=0.889 for the numerical data; St=1 for the analytic baselines). The enlarged orange cross at Mpl = 10 M⊕ denotes the fiducial simulation depicted in Fig. 8. Middle panel : ratio between poly- and monodisperse accretion rates, showing the numerical results for a static and evolving disc, as well as the analytic reference for a static disc. Bottom panel : ratio between the evolving and static accretion rates, for the monodisperse (solid) and polydisperse (dashed) populations, highlighting the impact of gas evolution on accretion efficiency. The sharp decline and increase at Mpl ≳ 17.5 M⊕ in all panels corresponds to the onset of pebble isolation.
Current usage metrics show cumulative count of Article Views (full-text article views including HTML views, PDF and ePub downloads, according to the available data) and Abstracts Views on Vision4Press platform.
Data correspond to usage on the plateform after 2015. The current usage metrics is available 48-96 hours after online publication and is updated daily on week days.
Initial download of the metrics may take a while.