Fig. 8
Download original image
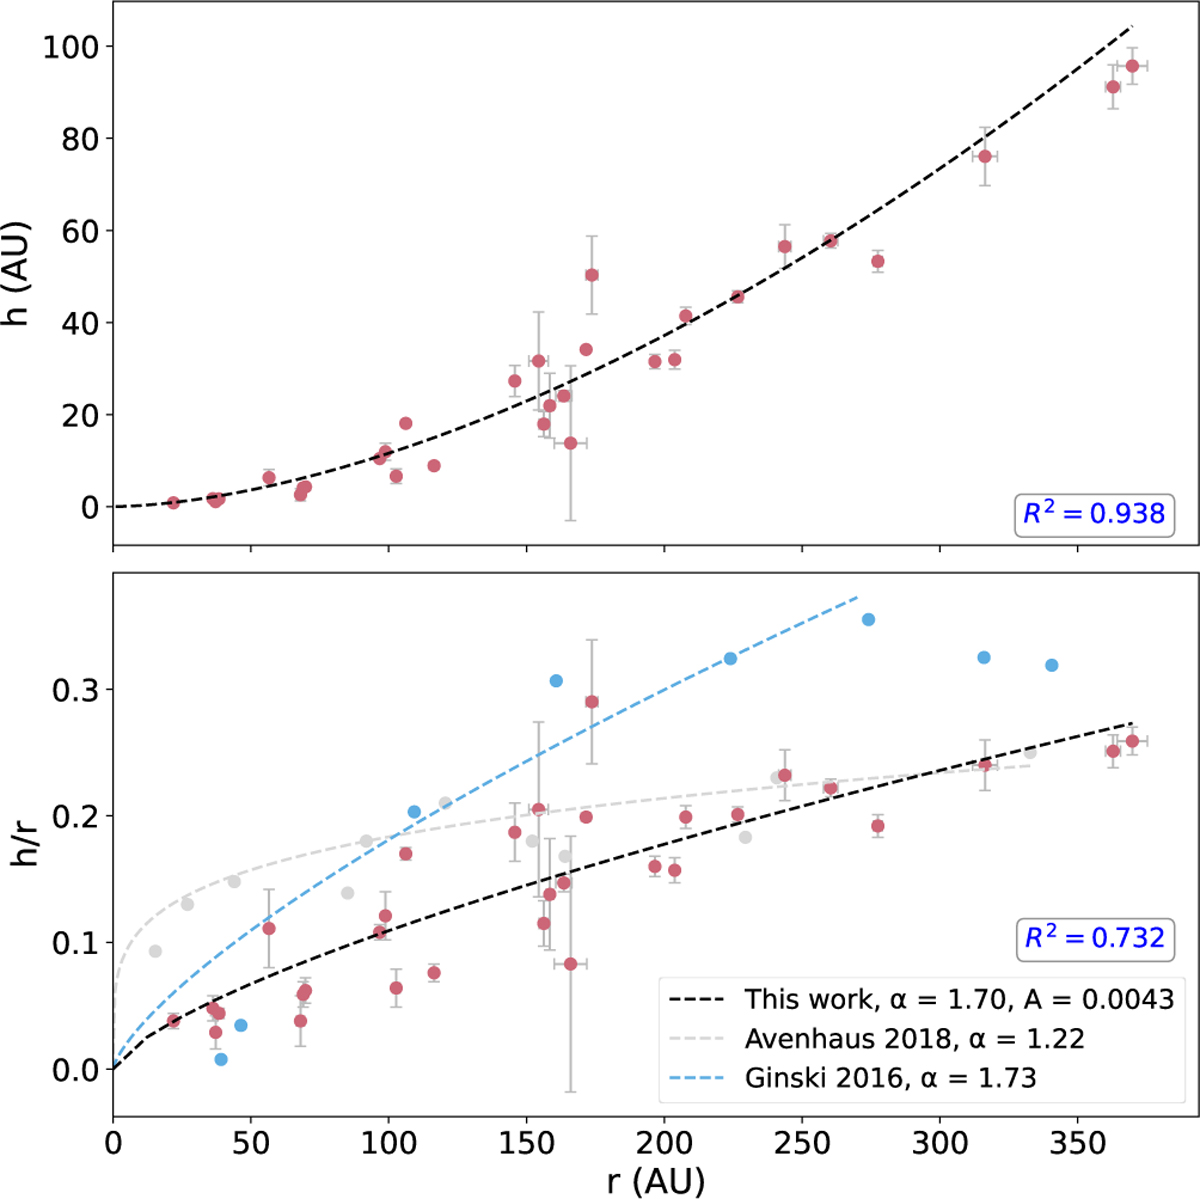
Two-panel visualisation of the disk vertical height (h) and aspect ratio (h/r) as a function of separation (r) for extended disks only (with a total extent of >150 au). R2 is shown the in bottom right corner of each plot. Top: power-law fit to h vs. r shows an increasing vertical structure consistent with flaring. Bottom: h/r vs. r with power-law fits overlaid for this work (black), and comparison to Avenhaus et al. (2018) and Ginski et al. (2016) shown in grey and light blue respectively.
Current usage metrics show cumulative count of Article Views (full-text article views including HTML views, PDF and ePub downloads, according to the available data) and Abstracts Views on Vision4Press platform.
Data correspond to usage on the plateform after 2015. The current usage metrics is available 48-96 hours after online publication and is updated daily on week days.
Initial download of the metrics may take a while.