Fig. 6
Download original image
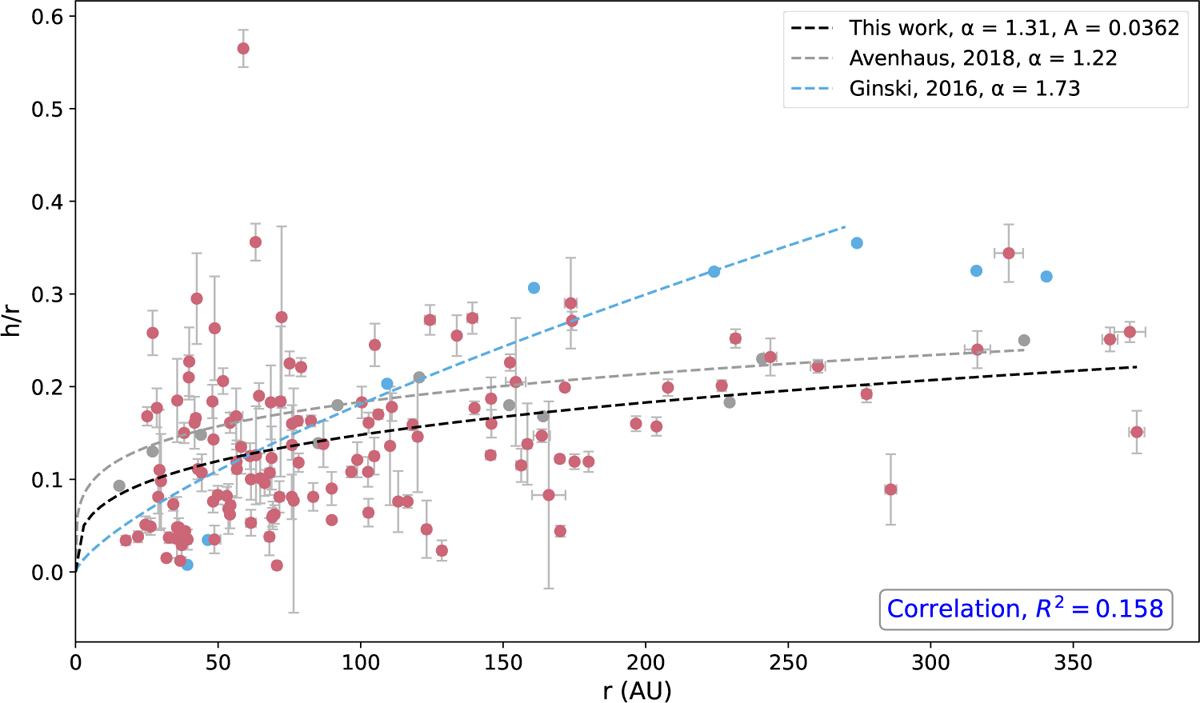
Aspect ratio (h/r) vs. separation (r) for the structures within the 92 disks, with 133 measurements (rose). A power-law model of the form ![]() was fit to the data using least squares (black). (R2) is shown in the bottom right corner. For comparison, power-law fits from Avenhaus et al. (2018) and Ginski et al. (2016) are overlaid along with their corresponding data points in grey and light blue, respectively.
was fit to the data using least squares (black). (R2) is shown in the bottom right corner. For comparison, power-law fits from Avenhaus et al. (2018) and Ginski et al. (2016) are overlaid along with their corresponding data points in grey and light blue, respectively.
Current usage metrics show cumulative count of Article Views (full-text article views including HTML views, PDF and ePub downloads, according to the available data) and Abstracts Views on Vision4Press platform.
Data correspond to usage on the plateform after 2015. The current usage metrics is available 48-96 hours after online publication and is updated daily on week days.
Initial download of the metrics may take a while.