Fig. 4
Download original image
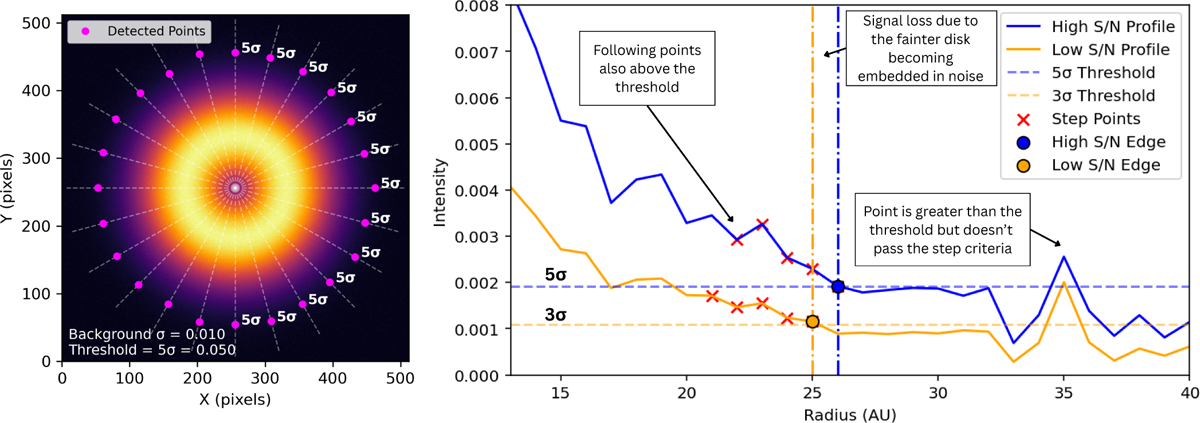
Left: idealistic example of the edge detection method using a synthetic circumstellar disk with added Gaussian background noise. The radial cuts (dashed white lines) sample intensity profiles iteratively. Magenta dots mark detected disk edges where intensity first (measured inwards towards the star) exceeds a 5σ noise primary threshold and passes the step function criteria. Edge labels are shown only on the right side of the disk (angles between 0° and 180° clockwise) for clarity. Background noise level (σ) and primary threshold (5σ) are annotated in the figure. Right: radial intensity profile extracted at 180° from the centre of GM Aur in H-band, comparing the real high-S/N case (blue) and a synthetically degraded low-S/N case (orange). Horizontal dashed lines indicate the 5σ and 3σ primary thresholds used for edge detection. Step points used to confirm edge detection are marked with red crosses, and the final detected edge locations are indicated by vertical dashed-dotted lines and filled circles. The low-S/N profile shows degraded detection performance and premature truncation due to the outer edge being buried in noise.
Current usage metrics show cumulative count of Article Views (full-text article views including HTML views, PDF and ePub downloads, according to the available data) and Abstracts Views on Vision4Press platform.
Data correspond to usage on the plateform after 2015. The current usage metrics is available 48-96 hours after online publication and is updated daily on week days.
Initial download of the metrics may take a while.