Fig. C.3
Download original image
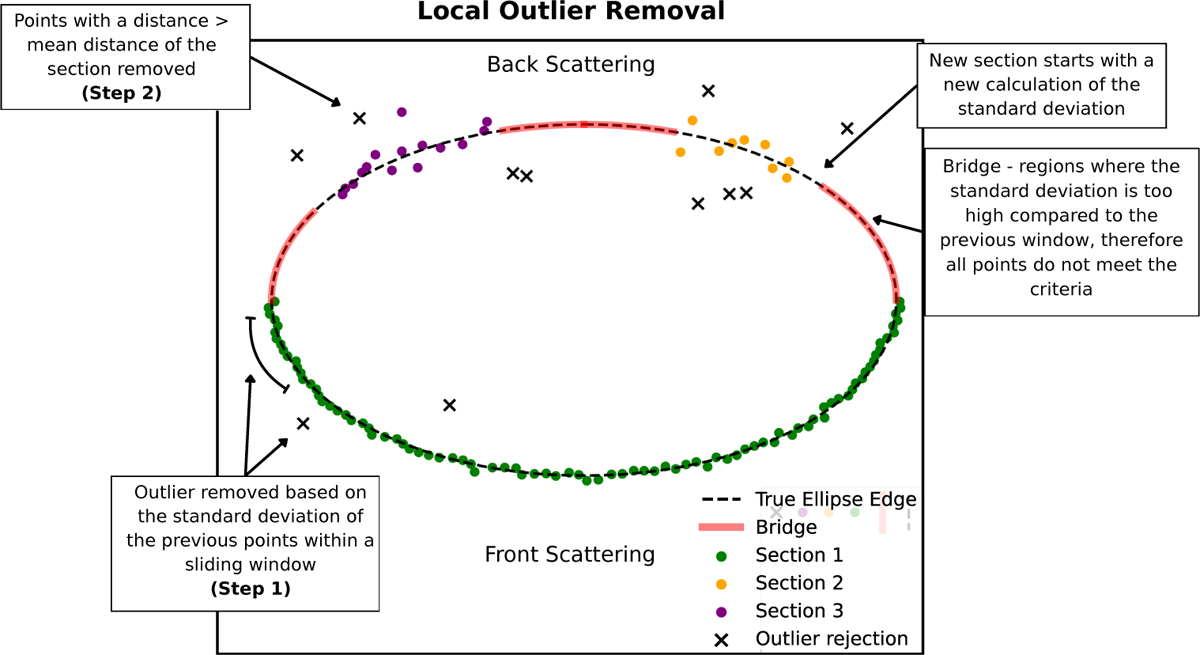
Diagram illustrating the two-step local outlier removal process. The elliptical disk is divided into angular sections based on series of outlier rejections from step 1. Section 1 (green) spans the bright, front-scattering side and undergoes step 1 filtering. Sections 2 (yellow) and 3 (purple) lie on the fainter, back-scattering side and are targeted by the second-stage rejection (black crosses). Red arcs (a bridge) mark angular gaps where the local standard deviation is inflated due to lower S/N, preventing the sliding window from identifying outliers. Defining new sections in these regions enables localised standard deviation recalculation, allowing for successful outlier detection across the back-scattering side.
Current usage metrics show cumulative count of Article Views (full-text article views including HTML views, PDF and ePub downloads, according to the available data) and Abstracts Views on Vision4Press platform.
Data correspond to usage on the plateform after 2015. The current usage metrics is available 48-96 hours after online publication and is updated daily on week days.
Initial download of the metrics may take a while.