Fig. 13
Download original image
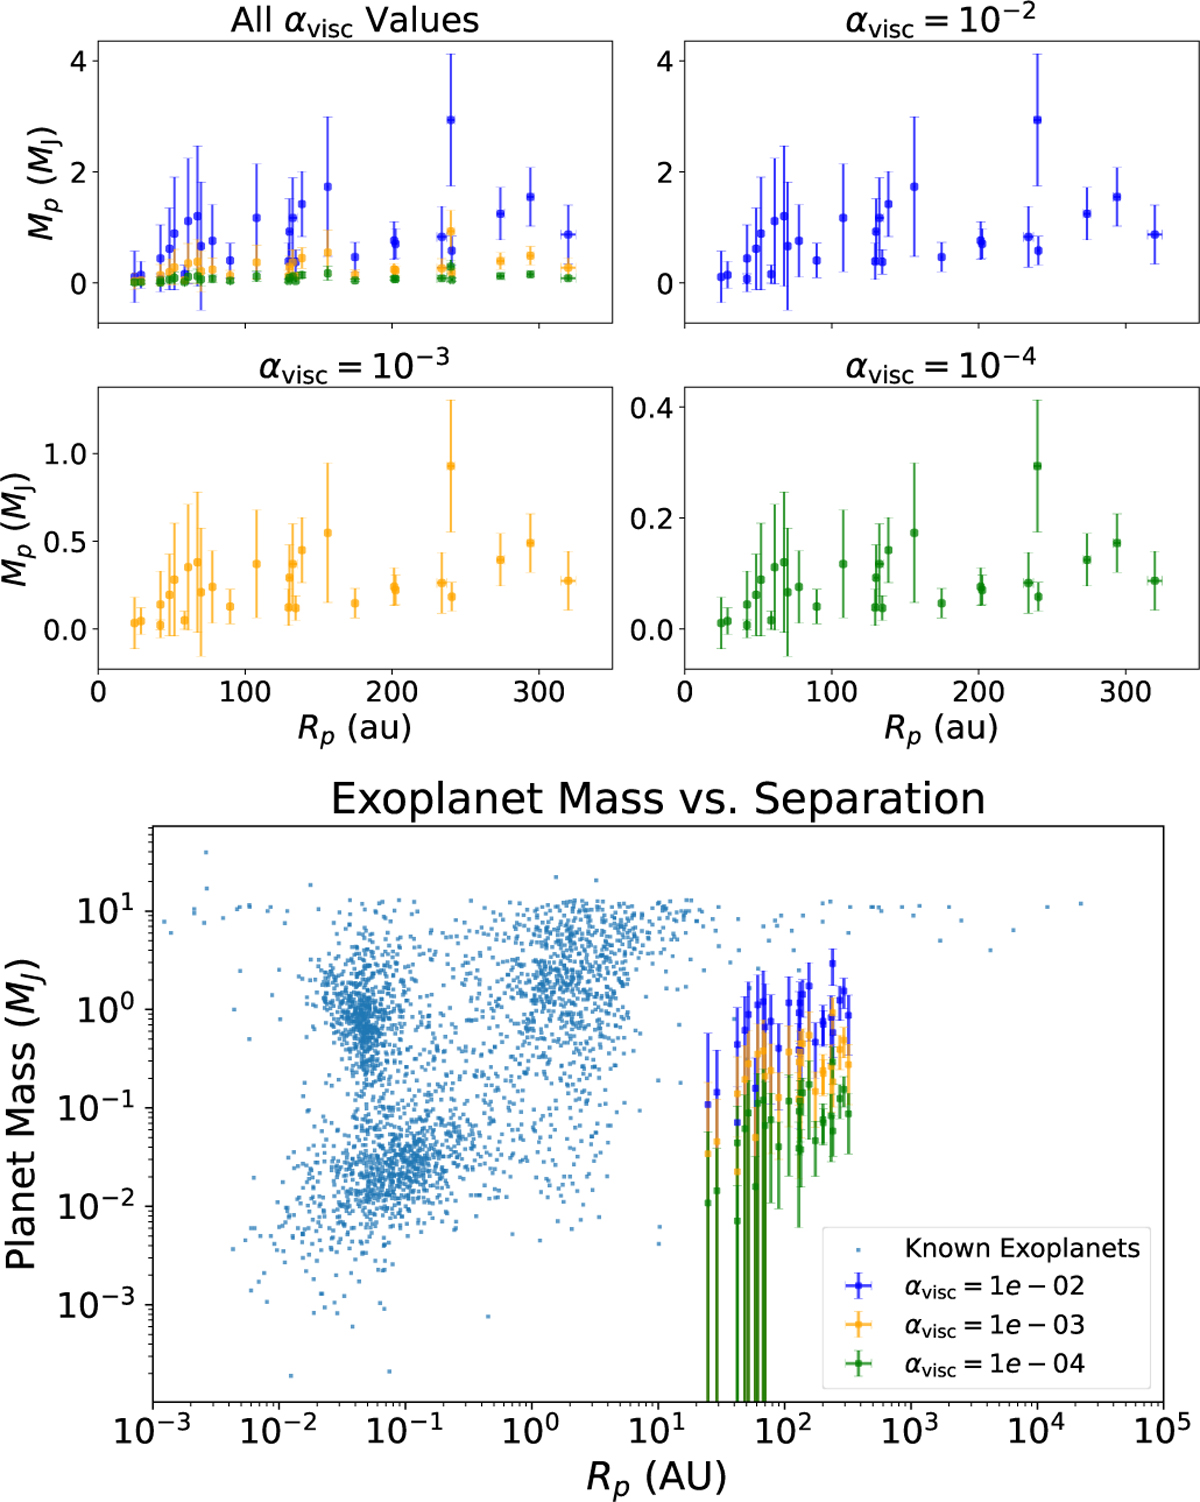
Top: planet mass (MJ) vs. separation of the inferred planet (Rp, au) for three different values of the disk viscosity parameter αvisc. The top left panel shows all αvisc values overlaid together. The remaining panels show individual plots for αvisc = 10−2, 10−3, and 10−4, respectively. The error bars represent uncertainties in the inferred planet mass and the measured gap radius. The plot highlights the dependence of inferred planet mass on αvisc, with lower viscosity requiring lower planet masses to carve equivalent gaps. Bottom: distribution of detected exo-planets plotted as mass (MJ) vs. separation (au). Blue points represent confirmed exoplanets from the exoplanet.eu database, where true masses are used when available and minimum masses (M × sin i) are used otherwise. Other coloured points correspond to the planet masses we inferred for different viscosities.
Current usage metrics show cumulative count of Article Views (full-text article views including HTML views, PDF and ePub downloads, according to the available data) and Abstracts Views on Vision4Press platform.
Data correspond to usage on the plateform after 2015. The current usage metrics is available 48-96 hours after online publication and is updated daily on week days.
Initial download of the metrics may take a while.