


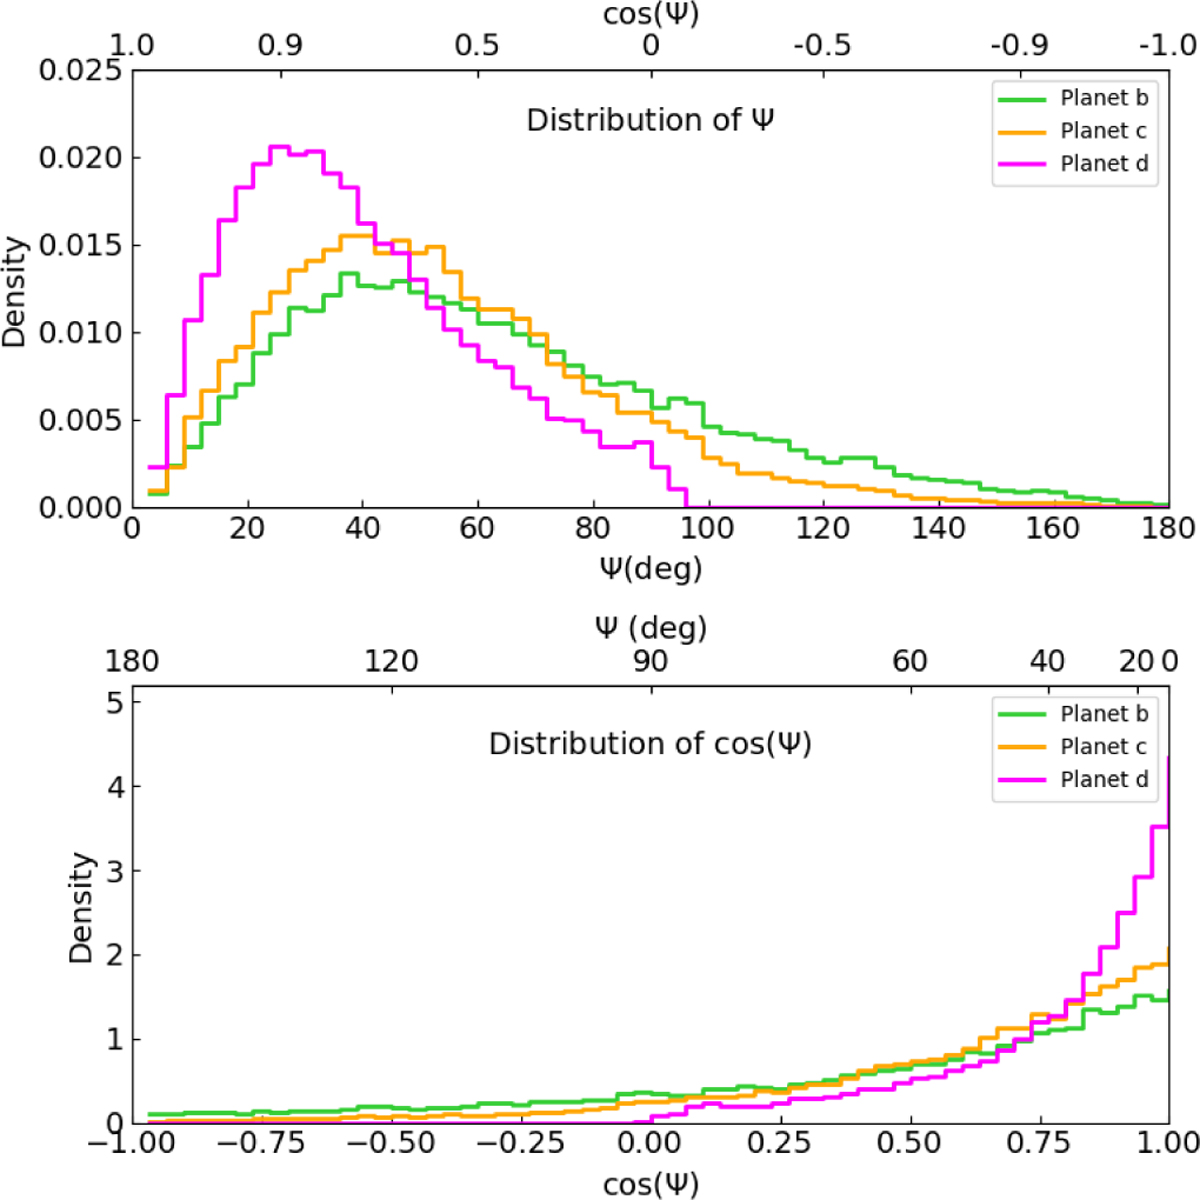
Fig. B.1
Download original image
Top panel: distribution of Ψ, with the top axis showing the corresponding cos(Ψ) values. Green, orange, and magenta curves corresponds to planet b, c, and d, respectively. Bottom panel: distribution of cos(Ψ) values before the trigonometric transformation, with the bottom axis showing cos(Ψ) and the top axis mapped to Ψ. The sharp contrast-between the two panels illustrate the non-linearity near the aligned case (0°).
Current usage metrics show cumulative count of Article Views (full-text article views including HTML views, PDF and ePub downloads, according to the available data) and Abstracts Views on Vision4Press platform.
Data correspond to usage on the plateform after 2015. The current usage metrics is available 48-96 hours after online publication and is updated daily on week days.
Initial download of the metrics may take a while.