Fig. 8
Download original image
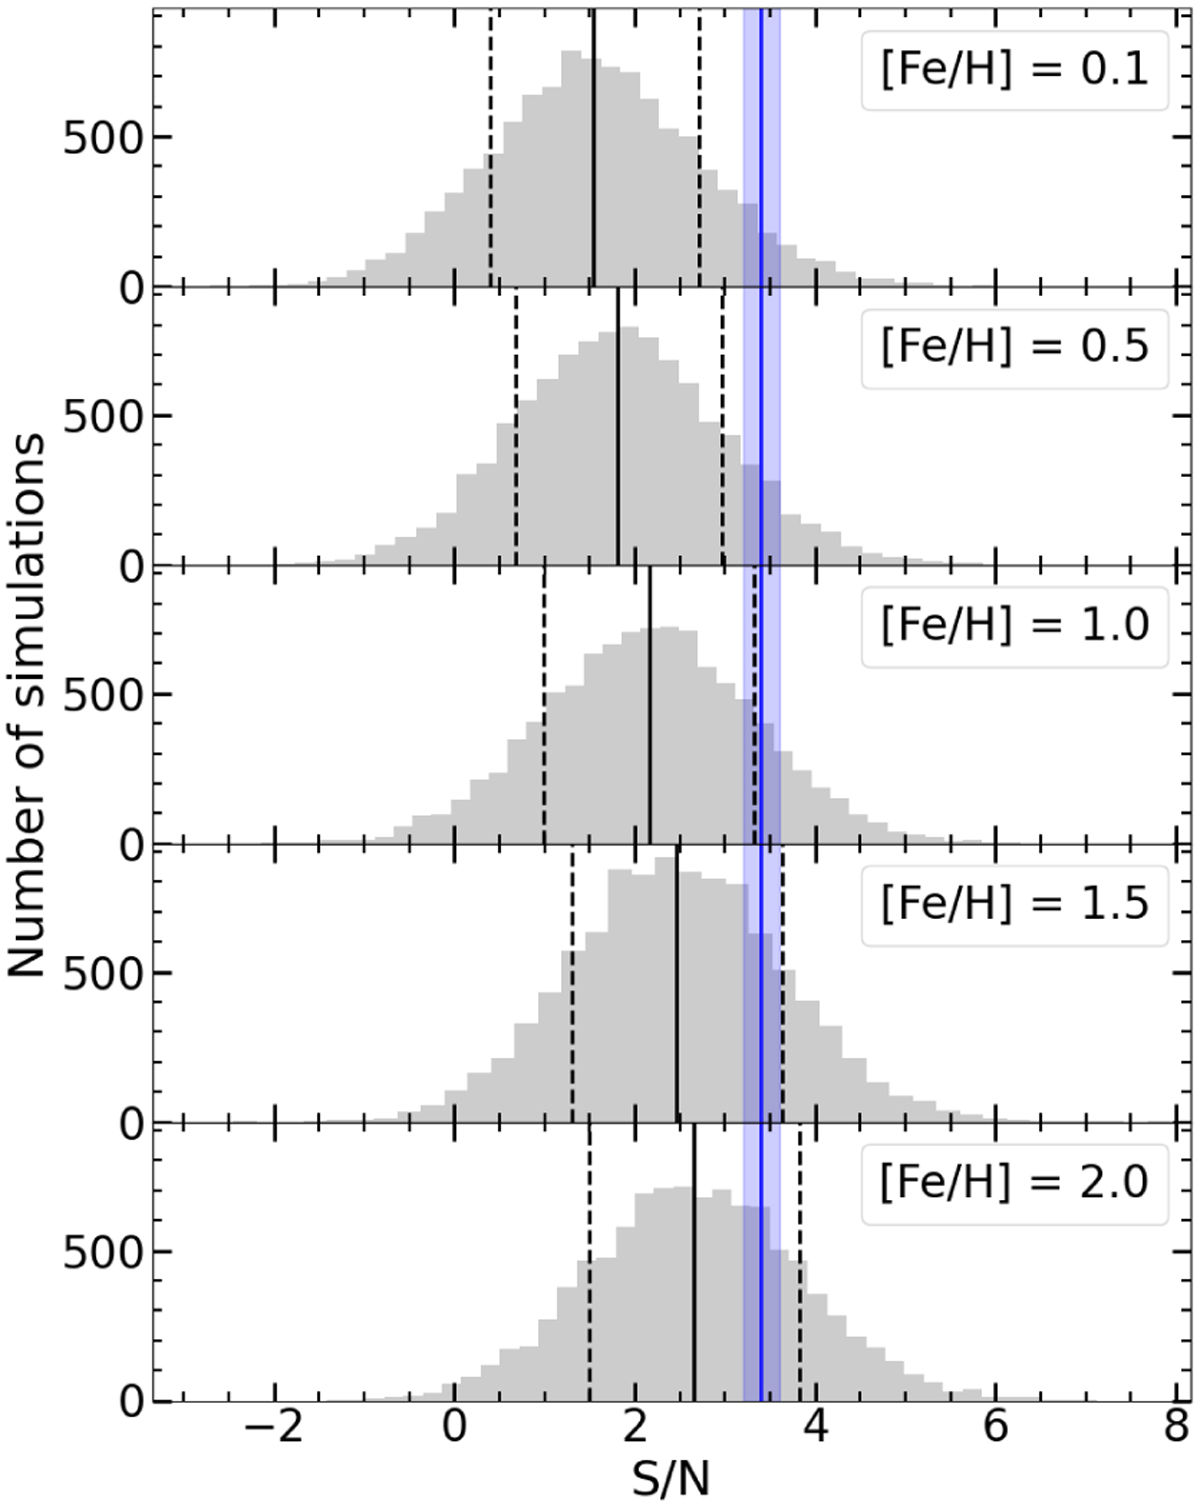
Distribution of the S/N of Fe I signals using the CCF method and synthetic spectra computed for different metallicities (stellar metallicity is [Fe/H] = 0.1 dex). The peak of the distribution lies at the 50th percentile (solid black line), while the 16th and 84th percentiles are shown by the dashed black lines. The measured S/N of the tentative Fe I detection in GJ 436 b’s atmosphere using the ESPRESSO observations (S/N = 3.4 ± 0.2) is indicated by the blue band.
Current usage metrics show cumulative count of Article Views (full-text article views including HTML views, PDF and ePub downloads, according to the available data) and Abstracts Views on Vision4Press platform.
Data correspond to usage on the plateform after 2015. The current usage metrics is available 48-96 hours after online publication and is updated daily on week days.
Initial download of the metrics may take a while.