Fig. 5
Download original image
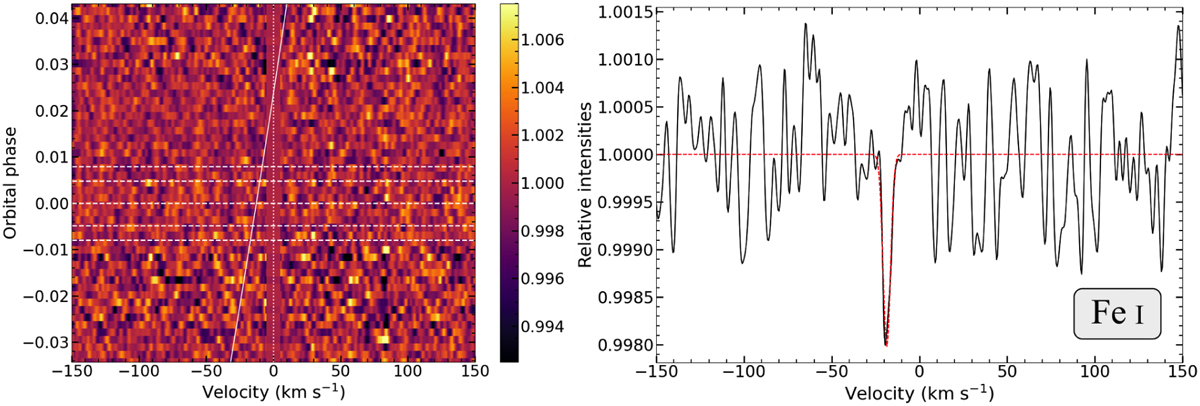
Left: tomography map of the CCFs calculated for Fe I at 1300 K for T1, in the stellar rest frame. The horizontal dashed lines indicate the orbital phases at the four contacts of the transit and at midtransit, and the slanted solid line marks the planetary velocities during the observation. The dotted vertical line indicates the stellar rest frame velocity. The stellar residuals between ± 5 km s−1 are masked out in the map. Right: 1300 K Fe I CCF of the combined in-transit planetary spectrum of T1 (solid black line), and Gaussian fit (dashed red line) of the tentative detected absorption feature. The planetary rest frame velocity is indicated by the dotted grey vertical line.
Current usage metrics show cumulative count of Article Views (full-text article views including HTML views, PDF and ePub downloads, according to the available data) and Abstracts Views on Vision4Press platform.
Data correspond to usage on the plateform after 2015. The current usage metrics is available 48-96 hours after online publication and is updated daily on week days.
Initial download of the metrics may take a while.