Fig. E.1
Download original image
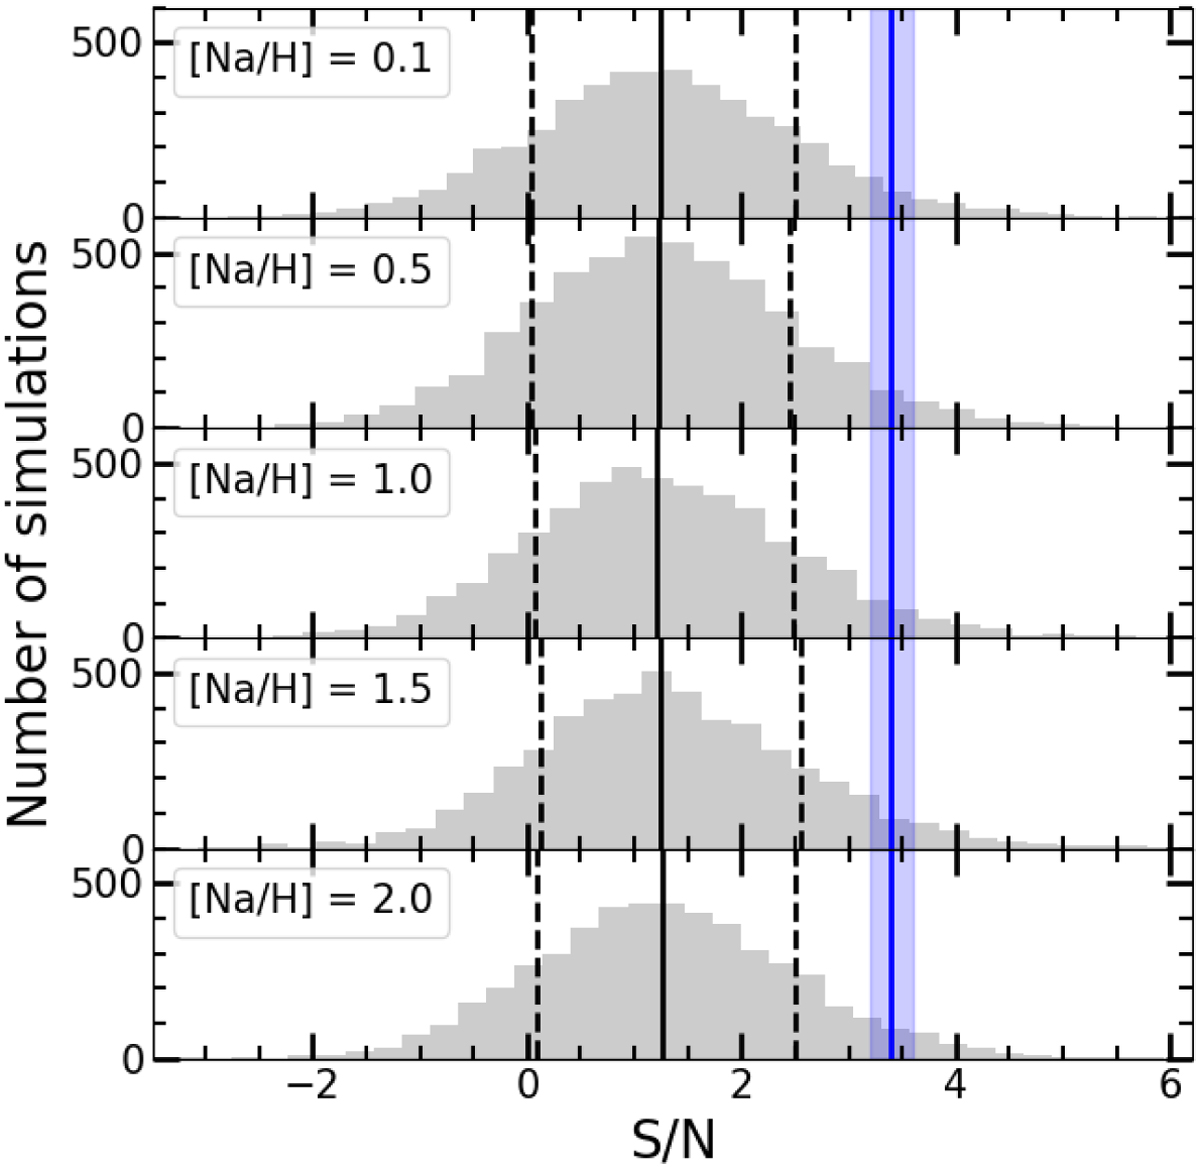
Results of the injection–recovery tests using Na I synthetic spectra computed for different Na abundances. For easy comparison with Fig. 8, the S/N of the tentative Fe I detection in T1 is indicated by the blue band. For all the Na abundances explored, the recovered S/N remains below the S/N measured for the Fe I signal in T1.
Current usage metrics show cumulative count of Article Views (full-text article views including HTML views, PDF and ePub downloads, according to the available data) and Abstracts Views on Vision4Press platform.
Data correspond to usage on the plateform after 2015. The current usage metrics is available 48-96 hours after online publication and is updated daily on week days.
Initial download of the metrics may take a while.