Fig. 2
Download original image
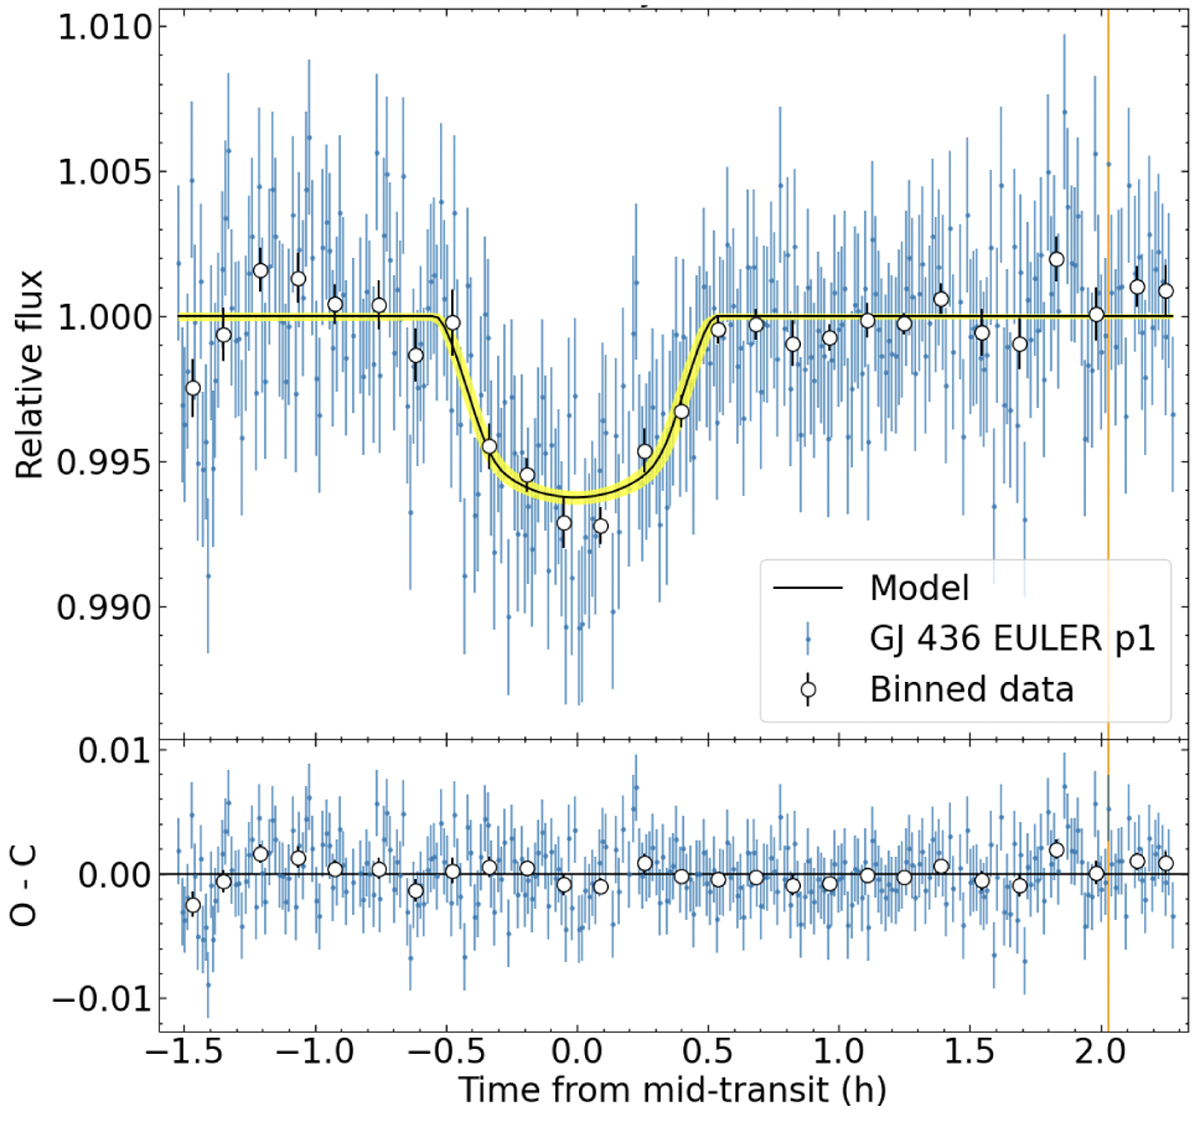
Top: Euler photometry (blue dots) taken with the Gunn r filter on the night of 2019 Feb 27. It is phase folded using GJ 436 b orbital period. The best fit model to the planetary transit and its 1σ uncertainty are depicted by the black line and the yellow area. Binned photometry (every 11 data points) is illustrated by the white dots. The starting time of the stellar flare seen in the ESPRESSO spectra is marked by the vertical orange line. Bottom: photometric residuals after removing the model from the observations.
Current usage metrics show cumulative count of Article Views (full-text article views including HTML views, PDF and ePub downloads, according to the available data) and Abstracts Views on Vision4Press platform.
Data correspond to usage on the plateform after 2015. The current usage metrics is available 48-96 hours after online publication and is updated daily on week days.
Initial download of the metrics may take a while.