Fig. A.6
Download original image
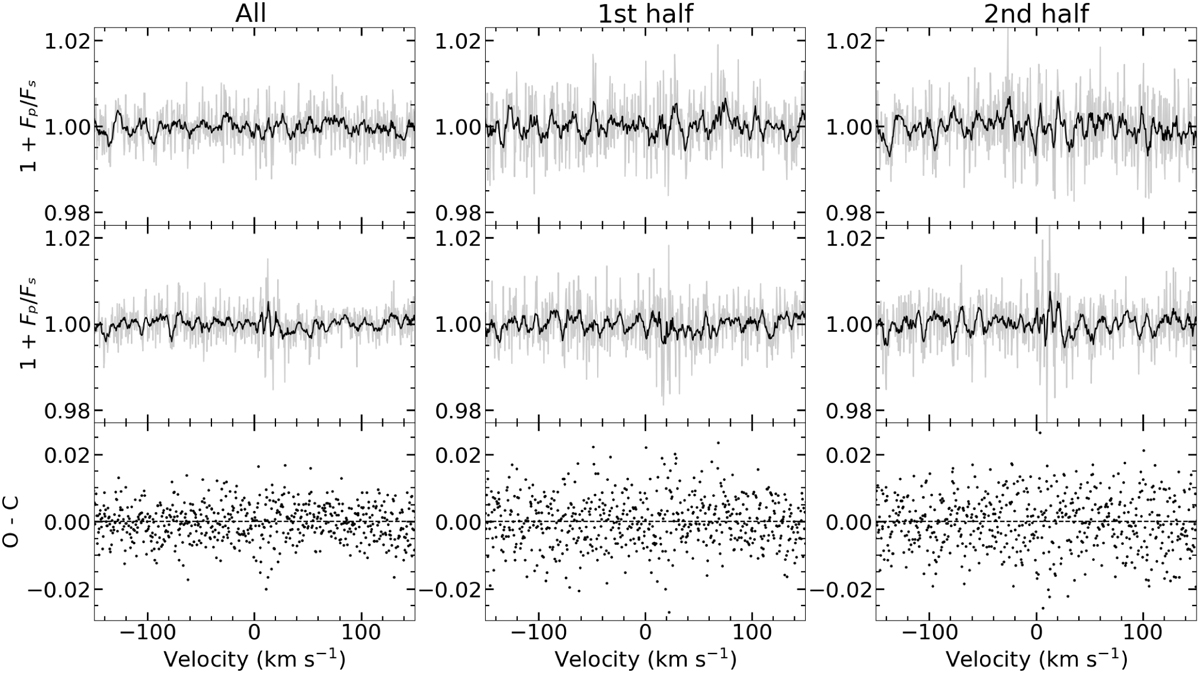
Top: Observed in-transit transmission spectrum in the Hα region for T1. The original data are shown in grey, while the smoothed version via a 9-point moving average is displayed in black. Middle: Modelled in-transit transmission spectrum for T1. Bottom: Residuals of the observed minus the model data. These results are displayed for all the in-transit data (left), as well as separately for the first (centre) and the second (right) halves of the transit.
Current usage metrics show cumulative count of Article Views (full-text article views including HTML views, PDF and ePub downloads, according to the available data) and Abstracts Views on Vision4Press platform.
Data correspond to usage on the plateform after 2015. The current usage metrics is available 48-96 hours after online publication and is updated daily on week days.
Initial download of the metrics may take a while.