Fig. A.1
Download original image
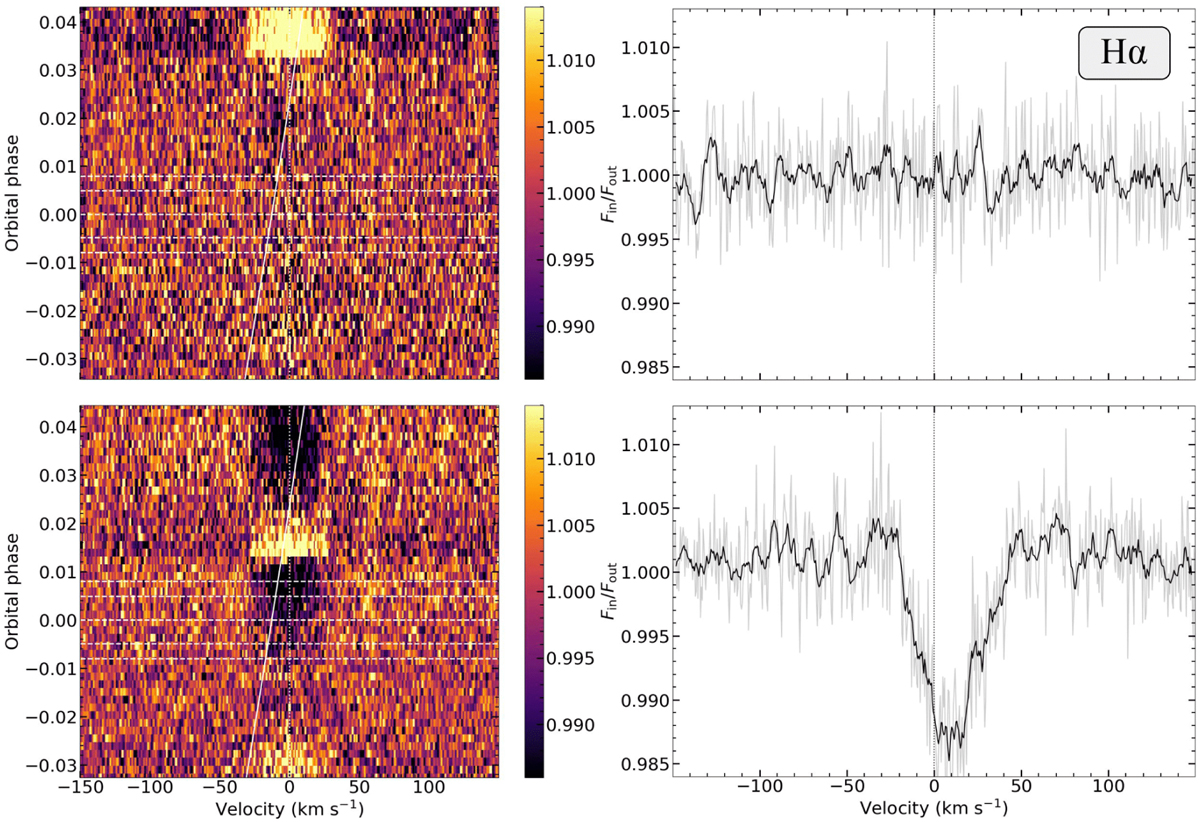
Left: T1 (top) and T2 (bottom) tomography maps in the stellar rest frame around the H α line. A 3-pixel moving average was applied along the velocity axis to smooth the maps. The horizontal dashed lines indicate the orbital phases at the four contacts of the transit and at midtransit, and the slanted solid line marks the planetary velocities during the observation. The dotted vertical line indicates the stellar rest frame velocity. Right: in-transit combined planetary spectrum around Hα in the planetary rest frame. The grey line represents the original spectrum, while the black line represents the spectrum after applying a 9-point moving average for increasing the S/N. The central wavelength of Hα is marked by the vertical line at 0 km s−1. The observed Hα absorption seen in the planetary spectrum of T2 is a product of stellar contamination (see Sect. 5.1)
Current usage metrics show cumulative count of Article Views (full-text article views including HTML views, PDF and ePub downloads, according to the available data) and Abstracts Views on Vision4Press platform.
Data correspond to usage on the plateform after 2015. The current usage metrics is available 48-96 hours after online publication and is updated daily on week days.
Initial download of the metrics may take a while.