


Fig. A.1.
Download original image
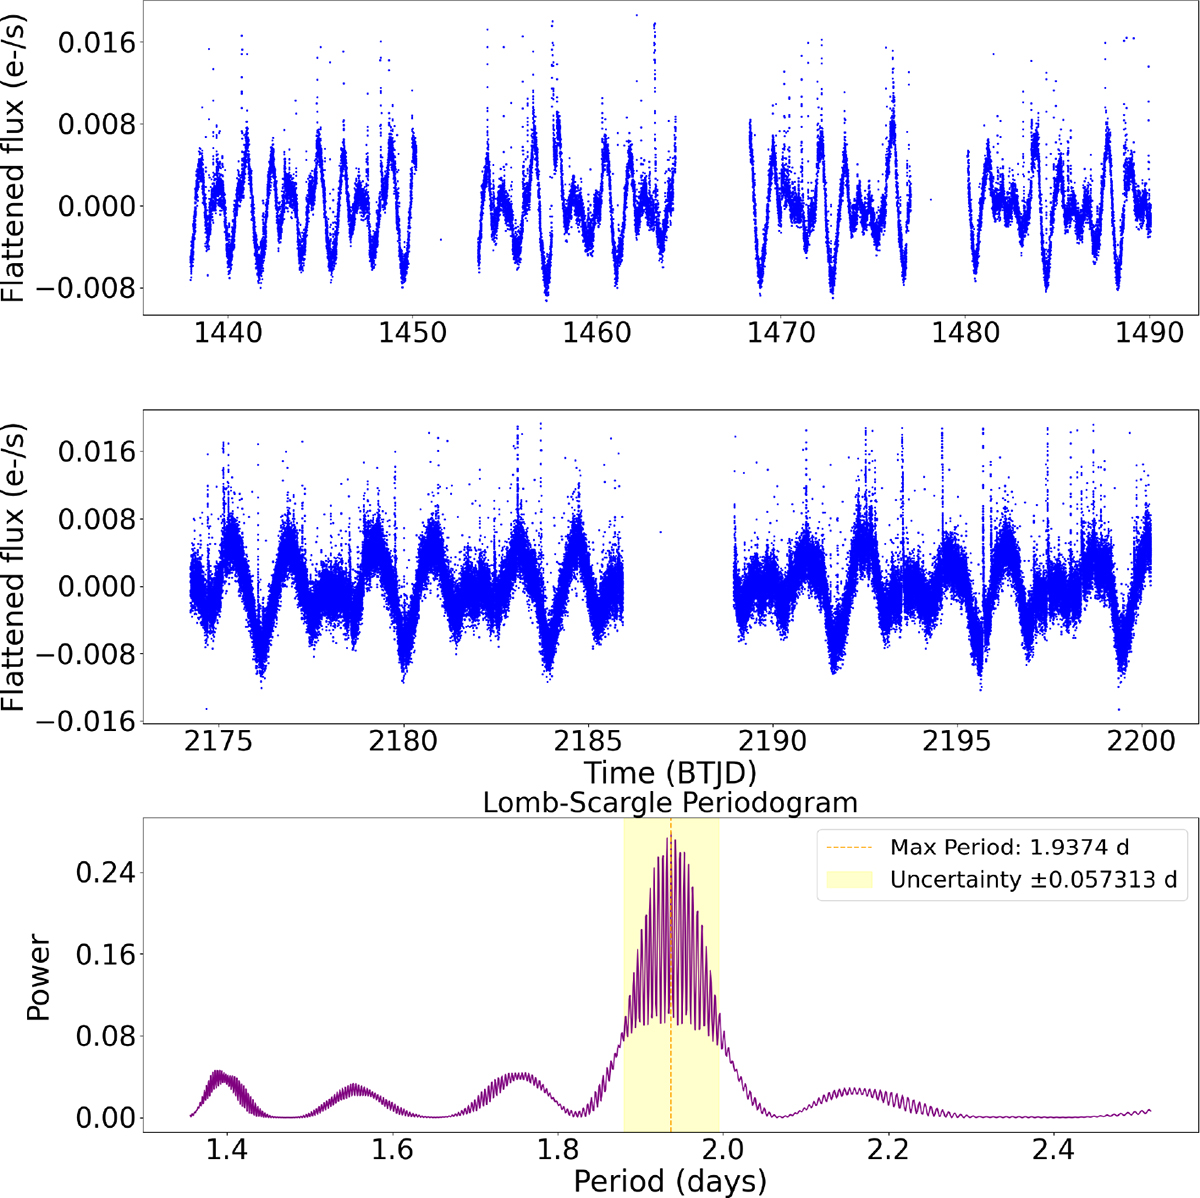
Light curves and Lomb-Scargle periodogram for the star CD-35 2213 observed by TESS. The first panel shows the light curve for sectors 0 and 1 combined. The second panel shows the light curve for sector 2. The third panel displays the Lomb-Scargle periodogram computed from all three sectors combined. The light curves exhibit rather frequent flaring, and an estimation of the period uncertainty indicated by the yellow shaded area.
Current usage metrics show cumulative count of Article Views (full-text article views including HTML views, PDF and ePub downloads, according to the available data) and Abstracts Views on Vision4Press platform.
Data correspond to usage on the plateform after 2015. The current usage metrics is available 48-96 hours after online publication and is updated daily on week days.
Initial download of the metrics may take a while.