


Fig. 10.
Download original image
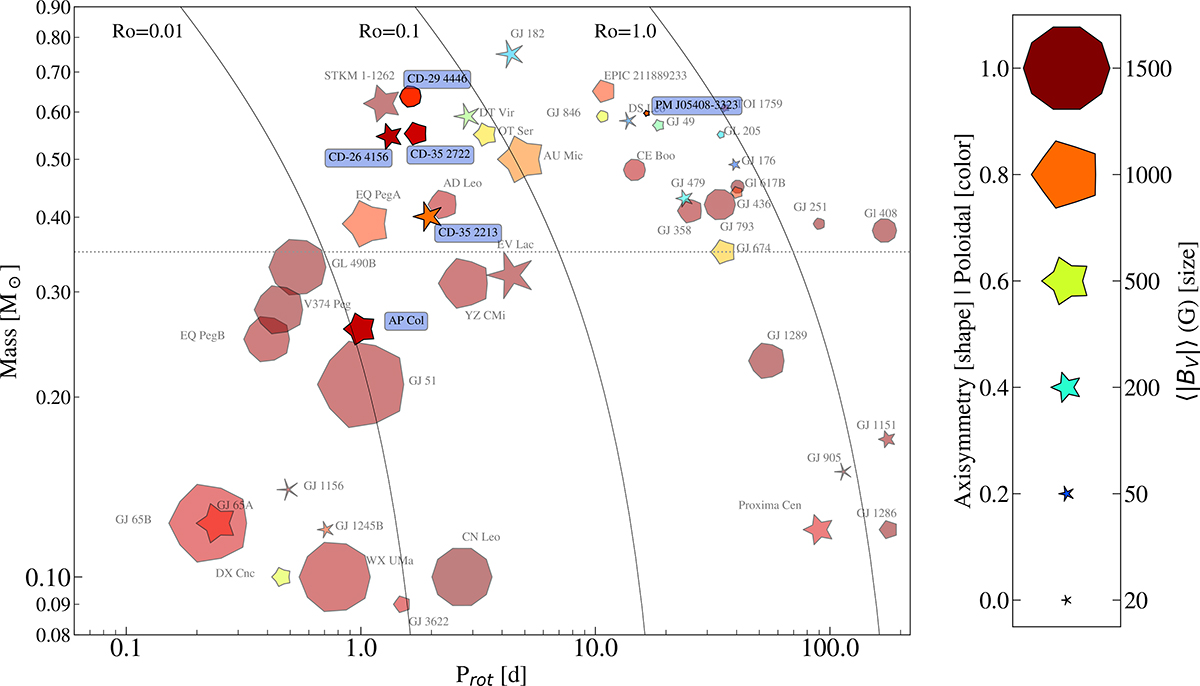
Magnetic properties of cool, single, main-sequence stars, derived from ZDI. Close binaries are excluded, as interactions between the stellar components may affect their rotation and magnetic properties (Tsvetkova et al. 2024). The axes represent the stellar rotation period (horizontal) and stellar mass (vertical). The grey curves indicate different Rossby numbers (Ro = 0.01, 0.1, and 1.0), calculated using the empirical relations from Wright et al. (2018), which quantify the ratio of rotation to convective turnover time. The symbols in the plot encode three properties of the stellar magnetic field. The size of each symbol indicates the average magnetic field strength; the larger symbols correspond to stronger fields. The colour represents the poloidal/toroidal energy fraction: the more the colour shifts towards red, the more poloidal the field; conversely, the more it shifts towards blue, the more toroidal the field. Finally, the shape of the symbol reflects the degree of axisymmetry: the more hexagonal the symbol, the higher the axisymmetry, while more star-like symbols with thinner branches indicate lower axisymmetry (see Morin et al. (2008b), Donati et al. (2008), Phan-Bao et al. (2009), Morin et al. (2010), Hébrard et al. (2016), Kochukhov & Lavail (2017), Moutou et al. (2017), Klein et al. (2021a,b), Willamo et al. (2022), Martioli et al. (2022), Bellotti et al. (2023a), Lehmann et al. (2024), Bellotti et al. (2025)). Our six targets, AP Col, CD-35 2213, CD-26 4156, CD-35 2722, CD-29 4446, and PM J05408-3323, are highlighted in blue.
Current usage metrics show cumulative count of Article Views (full-text article views including HTML views, PDF and ePub downloads, according to the available data) and Abstracts Views on Vision4Press platform.
Data correspond to usage on the plateform after 2015. The current usage metrics is available 48-96 hours after online publication and is updated daily on week days.
Initial download of the metrics may take a while.