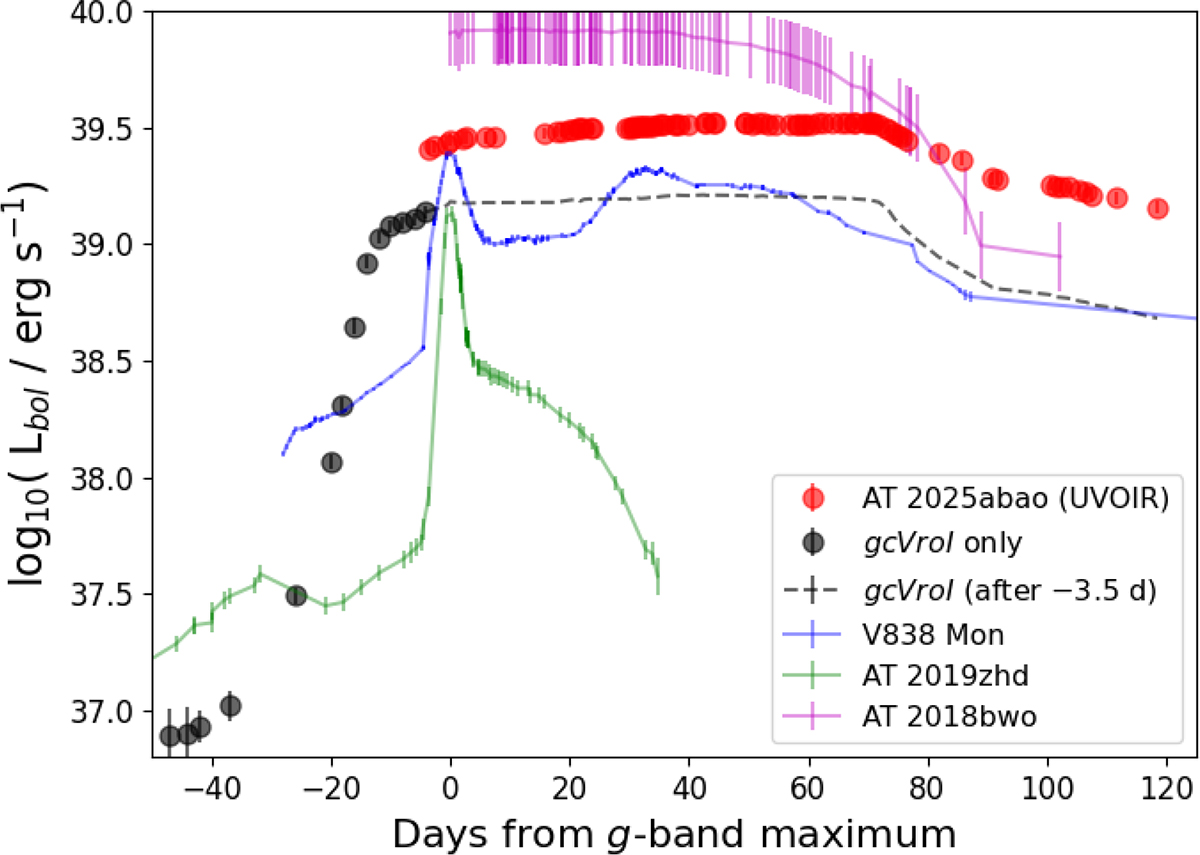
Fig. 5.
Download original image
Pseudo-bolometric (just the g, c, V, r, o, I bands) light curve of AT 2025abao, in black; and UV+Optical+NIR (UVW2 to K bands) bolometric curve of the main outburst, in red. The separation is made at phase −3.5 d, when our multi-band photometric follow-up campaign started (after this phase, the gcVroI pseudo-bolometric is shown as a dashed line). While the bolometric luminosity of AT 2025abao was similar to those of the comparison objects at the time of the g-band maximum, the subsequent evolution is different.
Current usage metrics show cumulative count of Article Views (full-text article views including HTML views, PDF and ePub downloads, according to the available data) and Abstracts Views on Vision4Press platform.
Data correspond to usage on the plateform after 2015. The current usage metrics is available 48-96 hours after online publication and is updated daily on week days.
Initial download of the metrics may take a while.