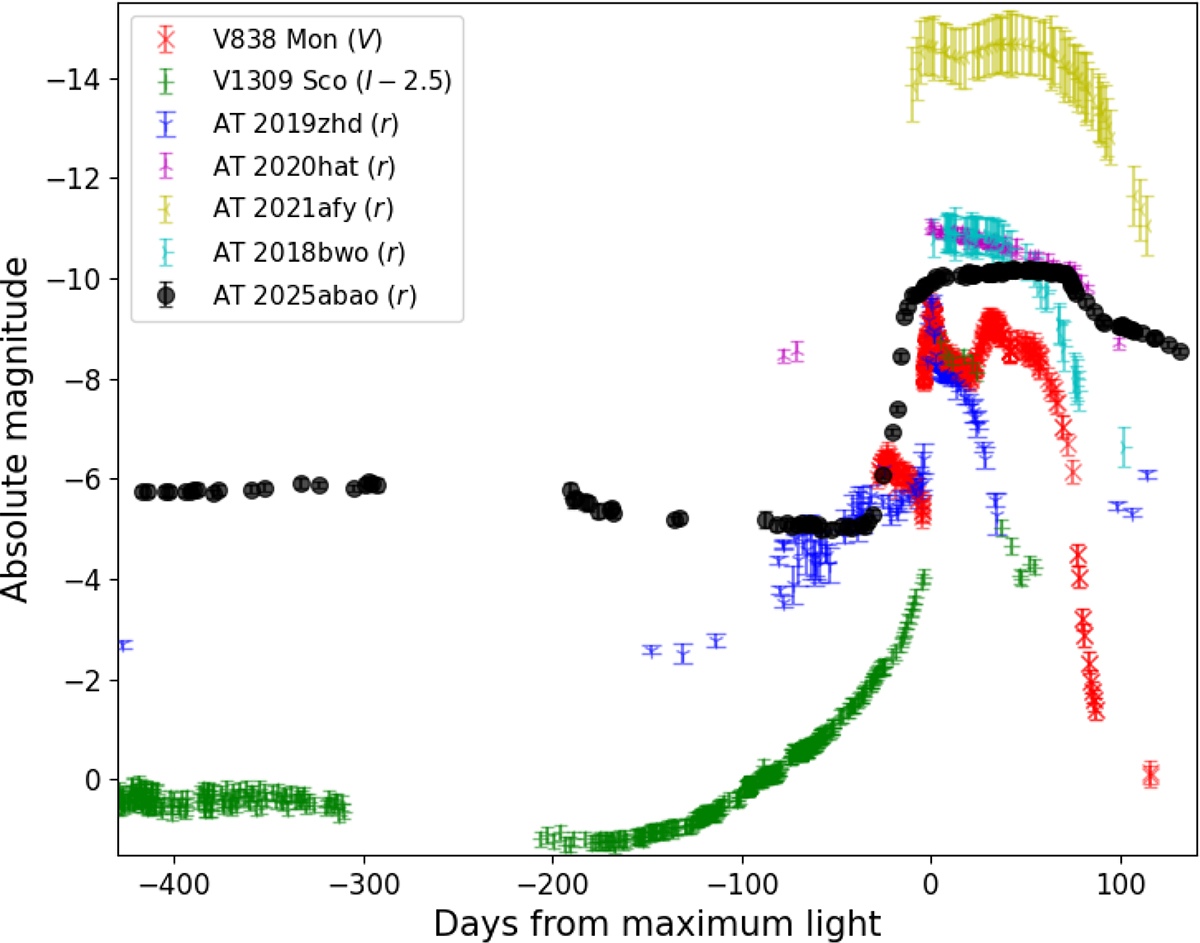
Fig. 4.
Download original image
Absolute light curve of AT 2025abao in the r band, compared with those of AT 2019zhd, V838 Mon (V-band), V1309 Sco (I-band), AT 2018bwo, AT 2020hat, and AT 2021afy. The light curve of V1309 Sco is scaled upwards by 2.5 magnitudes to match the peak brightness and to see the pre-outburst slow rise of both V1309 Sco and AT 2025abao. The error bar on the distance modulus of V1309 Sco (0.724 mag) is not shown.
Current usage metrics show cumulative count of Article Views (full-text article views including HTML views, PDF and ePub downloads, according to the available data) and Abstracts Views on Vision4Press platform.
Data correspond to usage on the plateform after 2015. The current usage metrics is available 48-96 hours after online publication and is updated daily on week days.
Initial download of the metrics may take a while.