Fig. 3.
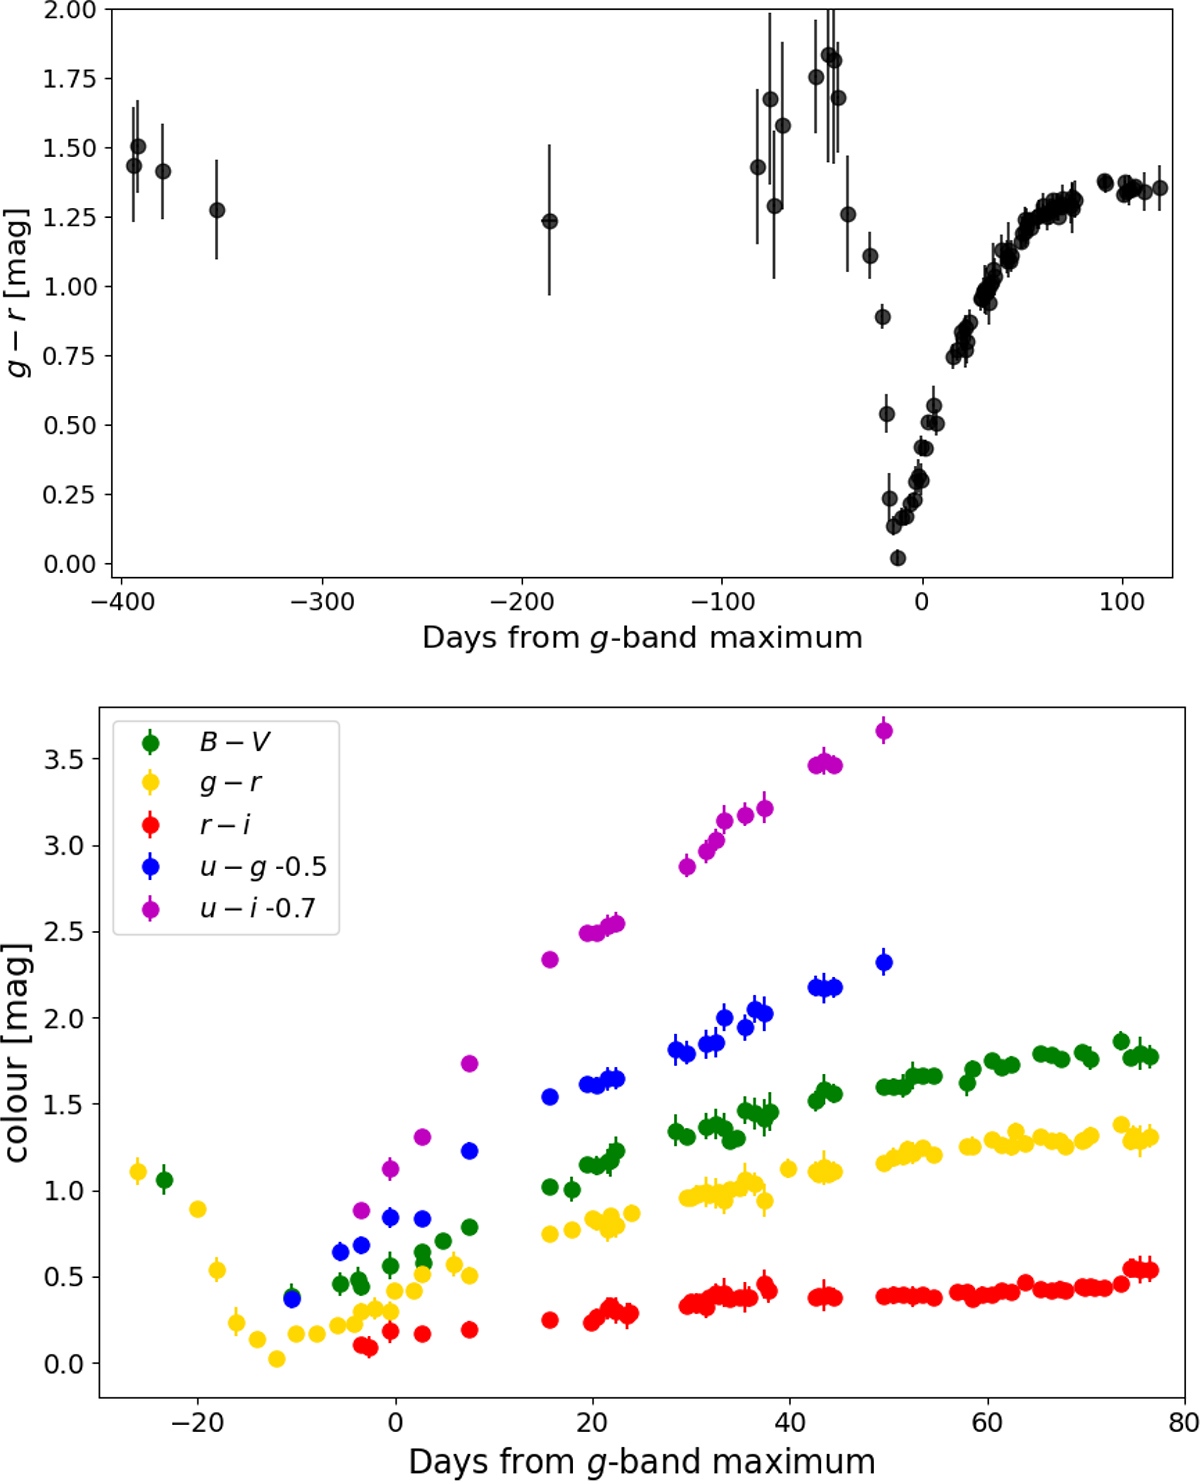
Download original image
Colour curves of AT 2025abao. Top panel: Evolution of the g − r colour from −1.1 yr to +3 months. The colour changes prominently between the slow pre-outburst rise and optically thick phase and the fast rise and the first peak. Bottom panel: Evolution of multiple colour curves (B − V, g − r, r − i, u − g, u − i) around the maximum light and plateau.
Current usage metrics show cumulative count of Article Views (full-text article views including HTML views, PDF and ePub downloads, according to the available data) and Abstracts Views on Vision4Press platform.
Data correspond to usage on the plateform after 2015. The current usage metrics is available 48-96 hours after online publication and is updated daily on week days.
Initial download of the metrics may take a while.