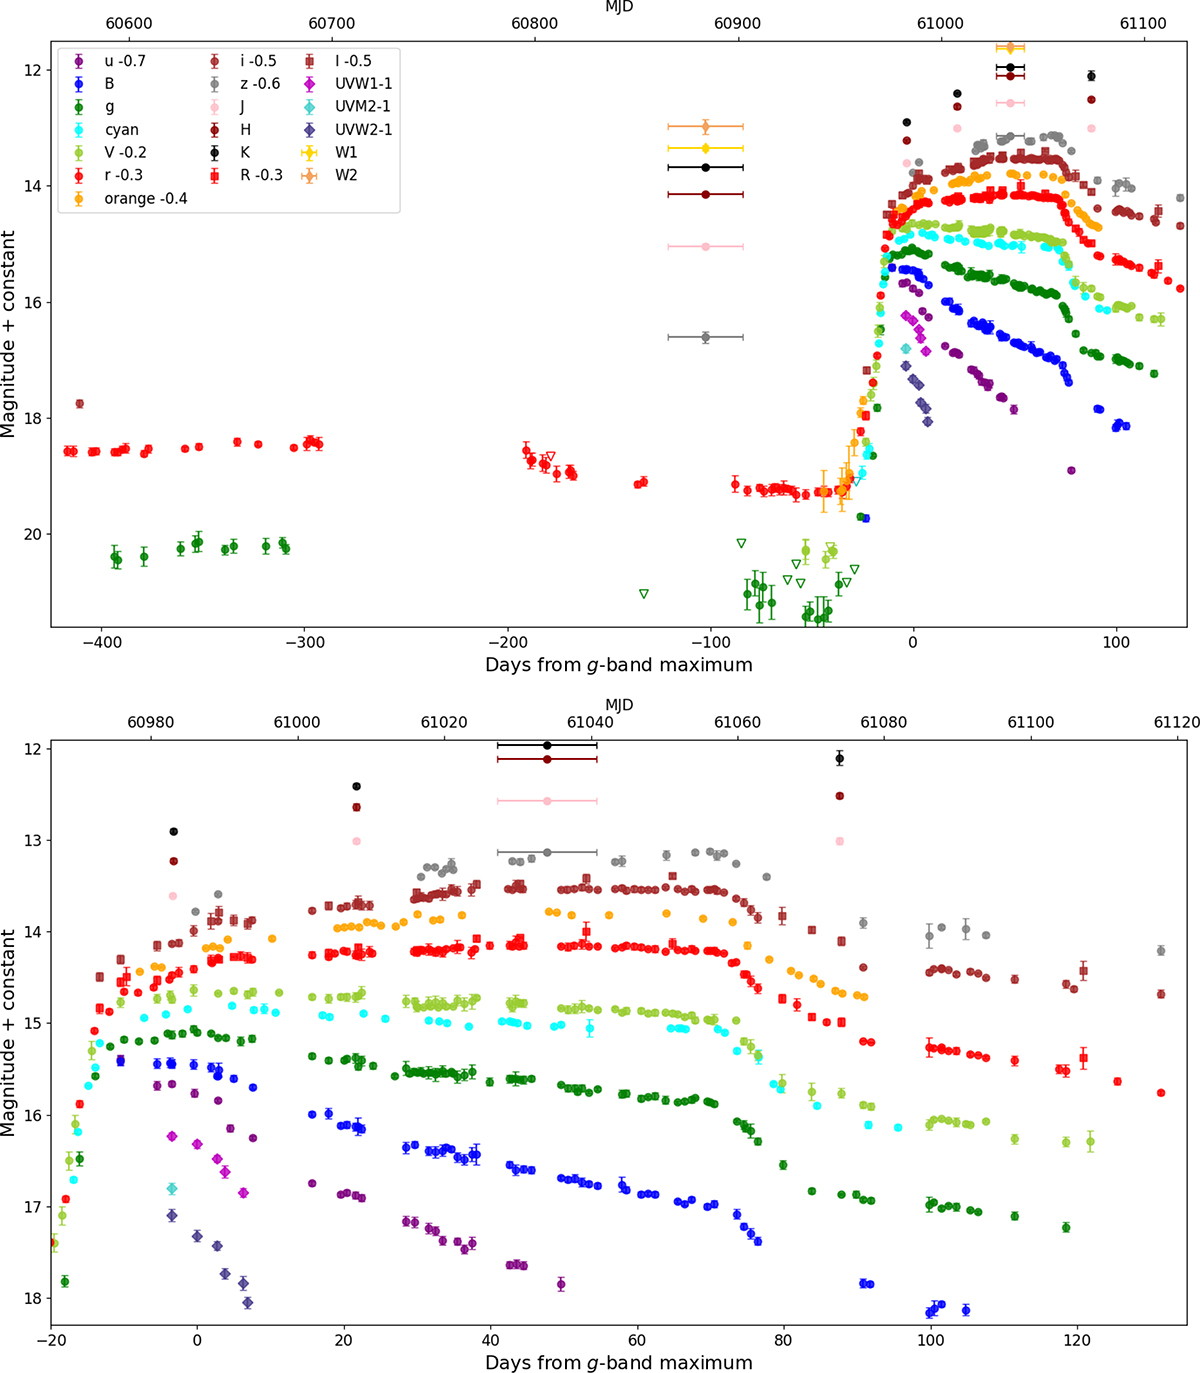
Fig. 2.
Download original image
Optical light curves of AT 2025abao. Top panel: the entire evolution since October 2024, when the follow-up campaign of WNTR23bzdiq conducted by K25 ended. The pre-LRN light curve, its decline to the minimum, and the final rapid rise to the LRN peak are visible. The temporal uncertainty in the spectrophotometry data from SPHEREx is due to the datapoints being collected across a time interval of about 5 and 2 weeks. Hence, the magnitudes are shown as taken at the mid-time of the interval, and with an error bar on the time. Bottom panel: zoom in on the fast rise towards the maximum light, the 70 days-long plateau, the fall from it, and the following linear decline.
Current usage metrics show cumulative count of Article Views (full-text article views including HTML views, PDF and ePub downloads, according to the available data) and Abstracts Views on Vision4Press platform.
Data correspond to usage on the plateform after 2015. The current usage metrics is available 48-96 hours after online publication and is updated daily on week days.
Initial download of the metrics may take a while.