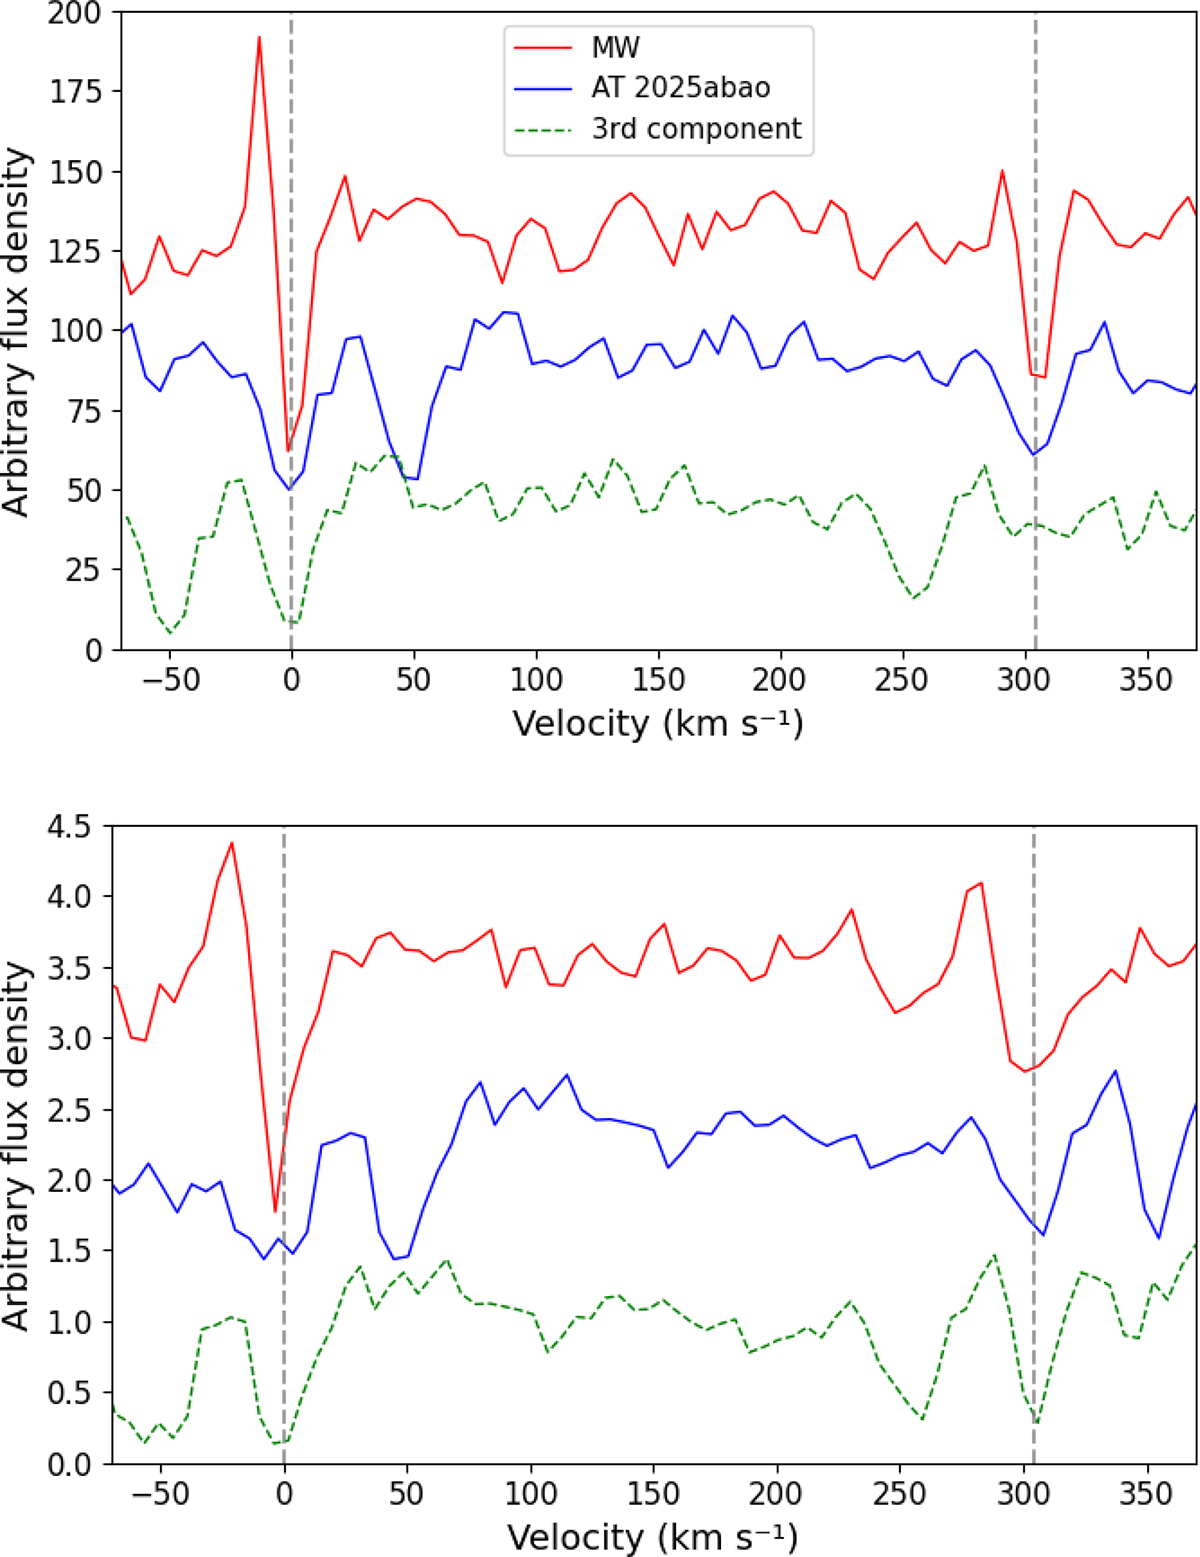
Fig. A.1.
Download original image
Zoomed-in view of the Na I D spectral region in the Echelle spectra. The Na I D doublets of the MW (red solid line) and that of the LRN (blue solid line) are plotted in the velocity space relative to the λ5890 line (Na I D2). Top: −3.4 d spectrum. The feature observed at λ5890.9, indicated as third component (green dashed line), is also shown at zero velocity. Adopting a tentative classification as an additional Na I D2 component redshifted by ∼50 km s−1 (e.g., from a gas cloud along the line of sight), we note however that the corresponding Na I D1 line is missing in this early spectrum. Bottom: +33.6 d spectrum. While the λ5890.9 feature is still visible, a new line appears at λ5896.9 at the expected wavelength of Na I D1, that we preferentially identify as an Fe I or a V II transition (see text).
Current usage metrics show cumulative count of Article Views (full-text article views including HTML views, PDF and ePub downloads, according to the available data) and Abstracts Views on Vision4Press platform.
Data correspond to usage on the plateform after 2015. The current usage metrics is available 48-96 hours after online publication and is updated daily on week days.
Initial download of the metrics may take a while.