Fig. 5
Download original image
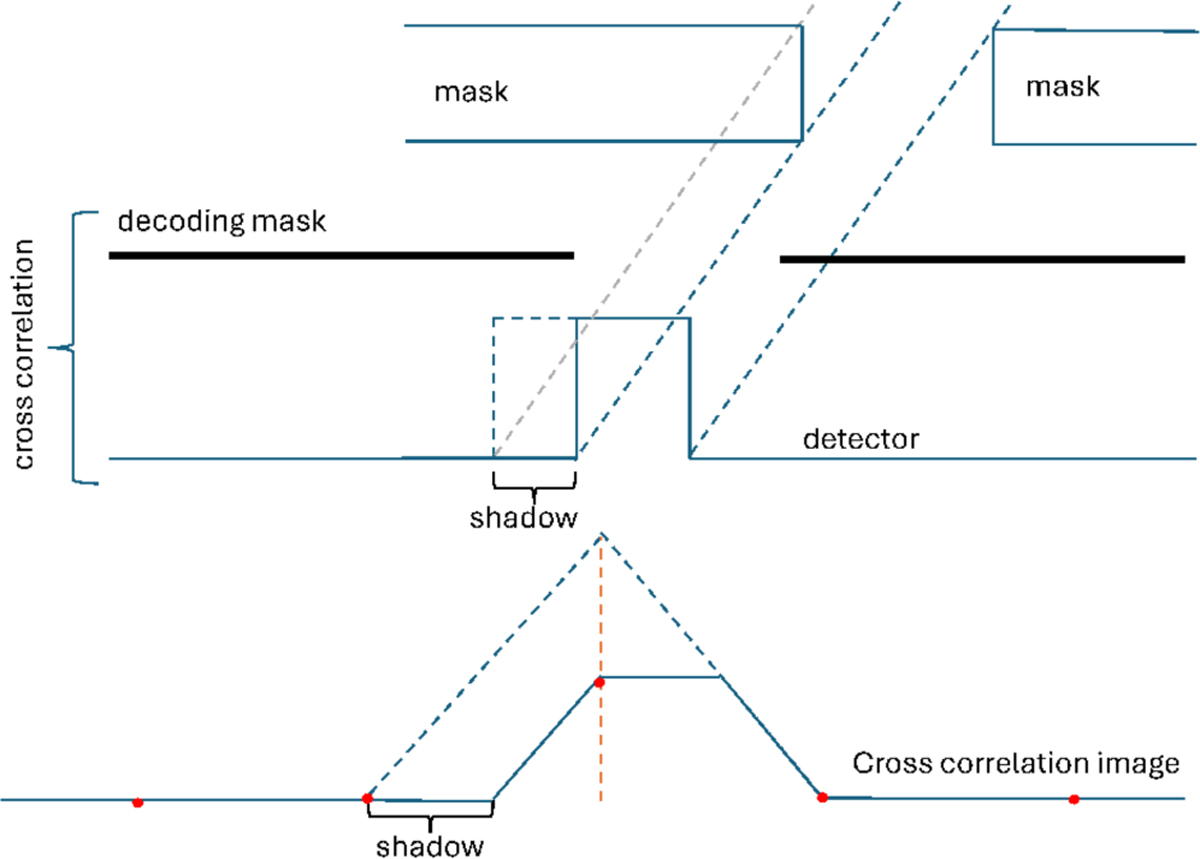
PSF formation along the “fine” direction. In the top section of the figure, the rays of an off-axis source illuminate the thick mask somewhat sideways and introduce a shadow on one side of the projection of the mask element on the detector (middle blue graph). When cross-correlating with the decoding mask (moving the decoding mask from left to right over the detector; see middle blue graph), this introduces (bottom blue graph) (1) a flat top to the PSF which is off-centered; (2) a lower PSF peak representative of a less sensitive area; and (3) a narrower PSF. The red dots indicate where the discrete cross-correlation would sample the PSF if the sampling is equal to the mask element size. The sampled cross-correlation looks like there is no shadowing, but its integral is actually smaller.
Current usage metrics show cumulative count of Article Views (full-text article views including HTML views, PDF and ePub downloads, according to the available data) and Abstracts Views on Vision4Press platform.
Data correspond to usage on the plateform after 2015. The current usage metrics is available 48-96 hours after online publication and is updated daily on week days.
Initial download of the metrics may take a while.