


Fig. 6.
Download original image
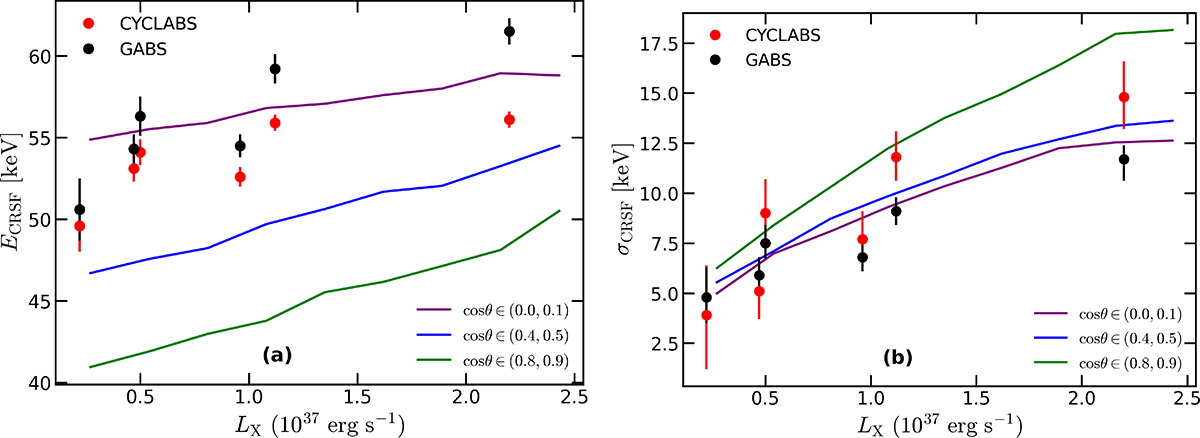
Comparison of observed cyclotron line variability in GX 304-1 with our model. Panel a (b) shows the CRSF centroid energy (width). Red and black circles represent the observed ECRSF and σCRSF values of GX 304-1, obtained using the CYCLABS model (Lorentzian profile) and the GABS model (Gaussian profile), respectively, to fit the line feature (Mushtukov et al. 2015b). Green, blue, and purple lines correspond to the results derived from our MC simulations for three different viewing angle intervals. The model predictions, for specific viewing angles, agree sufficiently well with the data over an order of magnitude in luminosity.
Current usage metrics show cumulative count of Article Views (full-text article views including HTML views, PDF and ePub downloads, according to the available data) and Abstracts Views on Vision4Press platform.
Data correspond to usage on the plateform after 2015. The current usage metrics is available 48-96 hours after online publication and is updated daily on week days.
Initial download of the metrics may take a while.