


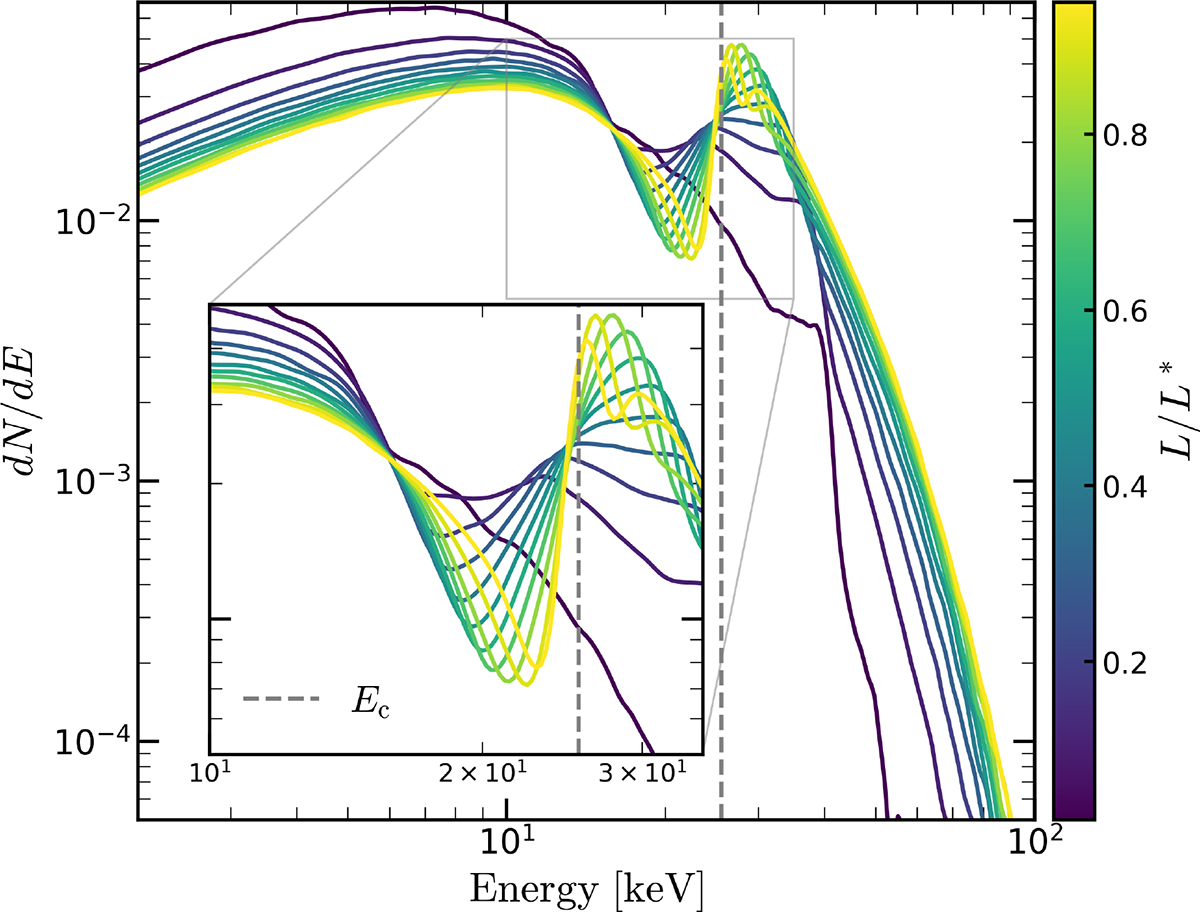
Fig. 4.
Download original image
Angle-averaged emergent spectra for luminosities spanning the range L/L* ∈ (0, 1). The color gradient from dark blue to yellow corresponds to increasing luminosity. The inset highlights the spectral region around the CRSF. The vertical gray dashed line denotes the local cyclotron energy. The positive correlation between L and the CRSF energy ECRSF is evident.
Current usage metrics show cumulative count of Article Views (full-text article views including HTML views, PDF and ePub downloads, according to the available data) and Abstracts Views on Vision4Press platform.
Data correspond to usage on the plateform after 2015. The current usage metrics is available 48-96 hours after online publication and is updated daily on week days.
Initial download of the metrics may take a while.