


Fig. 3.
Download original image
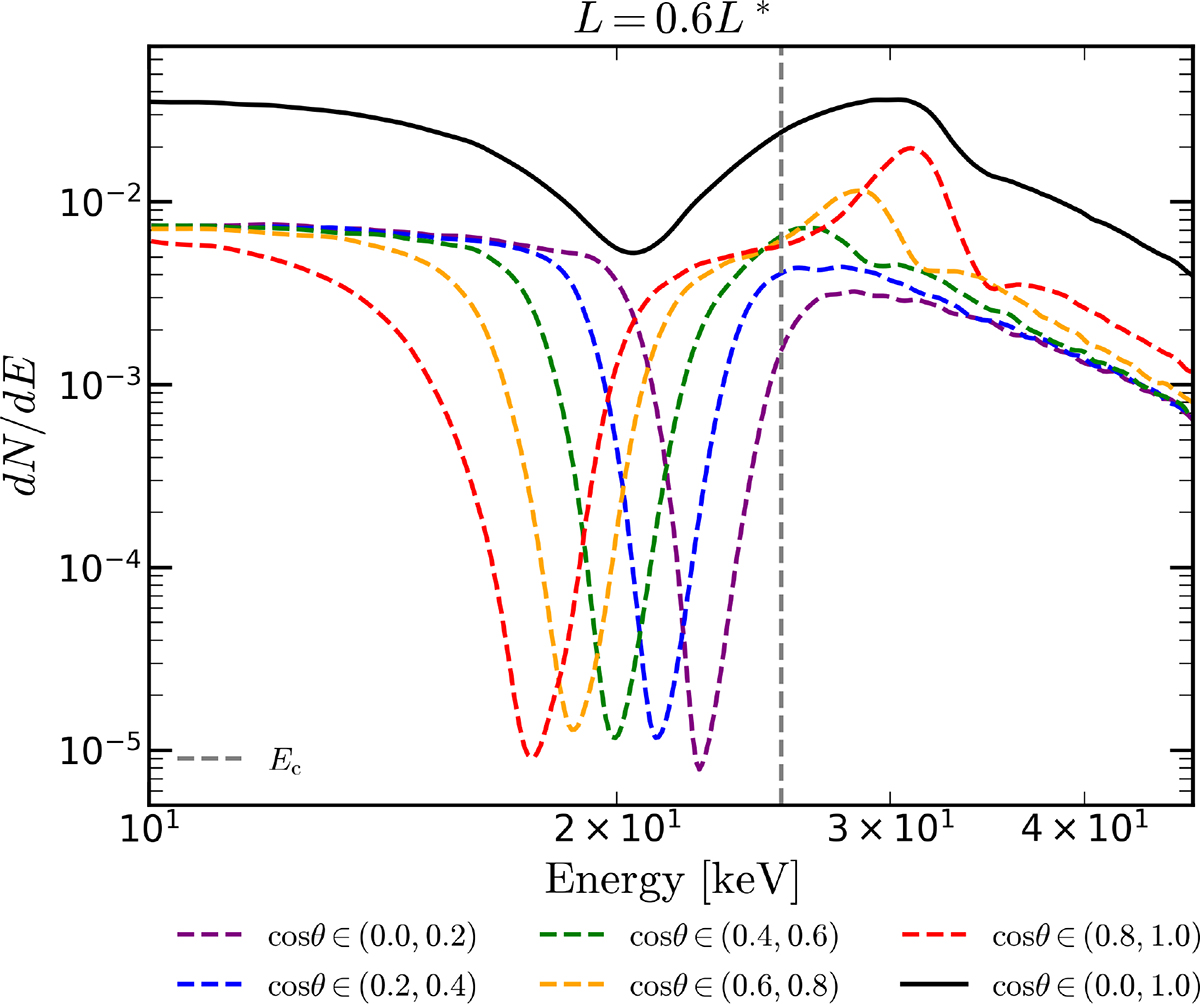
Angle-resolved spectra for a typical XRP source with luminosity L = 0.6L*. The solid black line corresponds to the angle-averaged spectrum in the range (0, π/2). The dashed colored lines show spectra extracted in five angular bins within this range. Each spectrum has been normalized to its angular flux contribution. The vertical gray line marks the local cyclotron energy. With increasing cos θ, the CRSF centroid energy shifts to lower values and the blue wing becomes more pronounced.
Current usage metrics show cumulative count of Article Views (full-text article views including HTML views, PDF and ePub downloads, according to the available data) and Abstracts Views on Vision4Press platform.
Data correspond to usage on the plateform after 2015. The current usage metrics is available 48-96 hours after online publication and is updated daily on week days.
Initial download of the metrics may take a while.