


Fig. 2.
Download original image
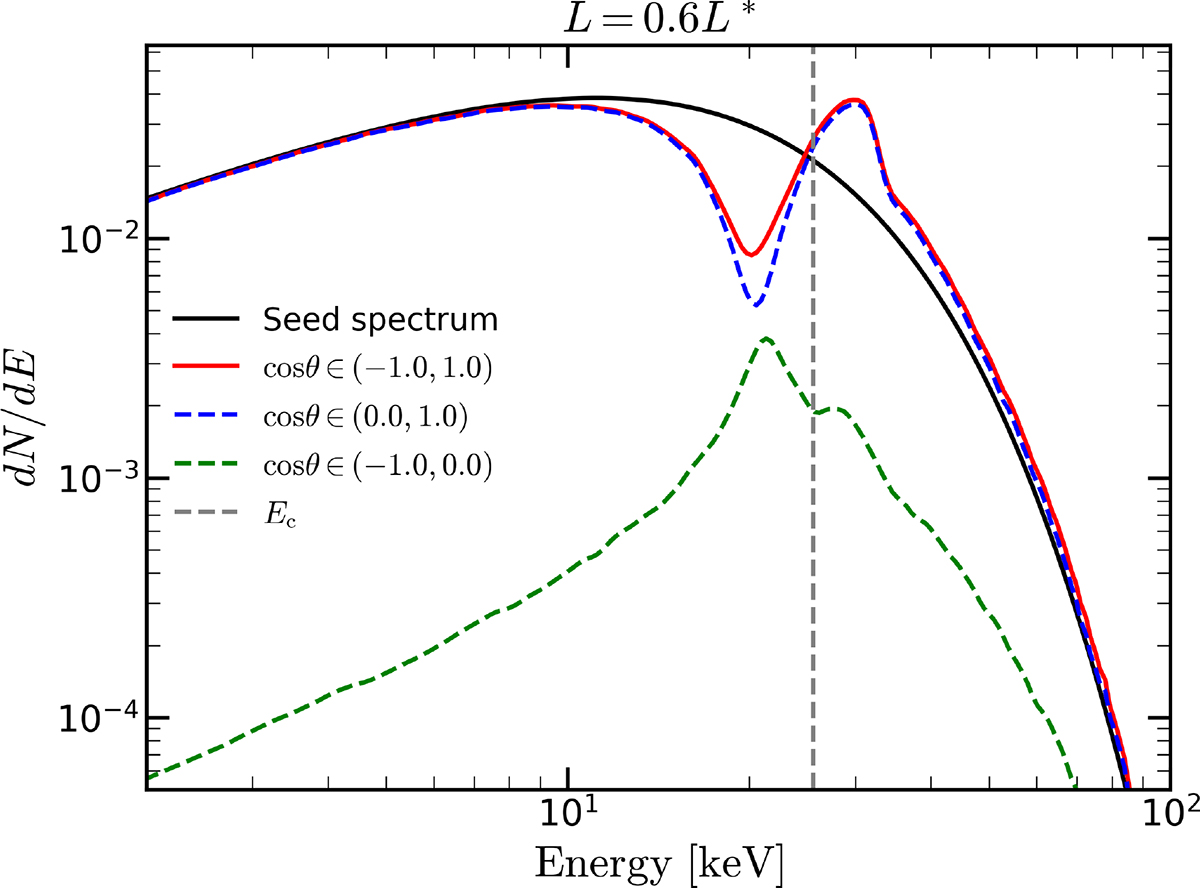
Representative emergent spectrum for an XRP with a fiducial luminosity L = 0.6L*. The solid black line represents the seed blackbody spectrum with temperature kBT = 5.9 keV. The solid red line shows the total normalized emergent spectrum. The dashed blue and green lines correspond to the angle-selected spectra observed at polar angles in the ranges (0, π/2) and (π/2, π), respectively. The vertical dashed gray line indicates the cyclotron energy at Ec = 25.55 keV. The spectrum features a redshifted, but prominent CRSF around E ∼ 20 keV followed by a bump. The angle-selected spectra are scaled relative to their contribution to the total photon flux.
Current usage metrics show cumulative count of Article Views (full-text article views including HTML views, PDF and ePub downloads, according to the available data) and Abstracts Views on Vision4Press platform.
Data correspond to usage on the plateform after 2015. The current usage metrics is available 48-96 hours after online publication and is updated daily on week days.
Initial download of the metrics may take a while.