


Fig. C.1.
Download original image
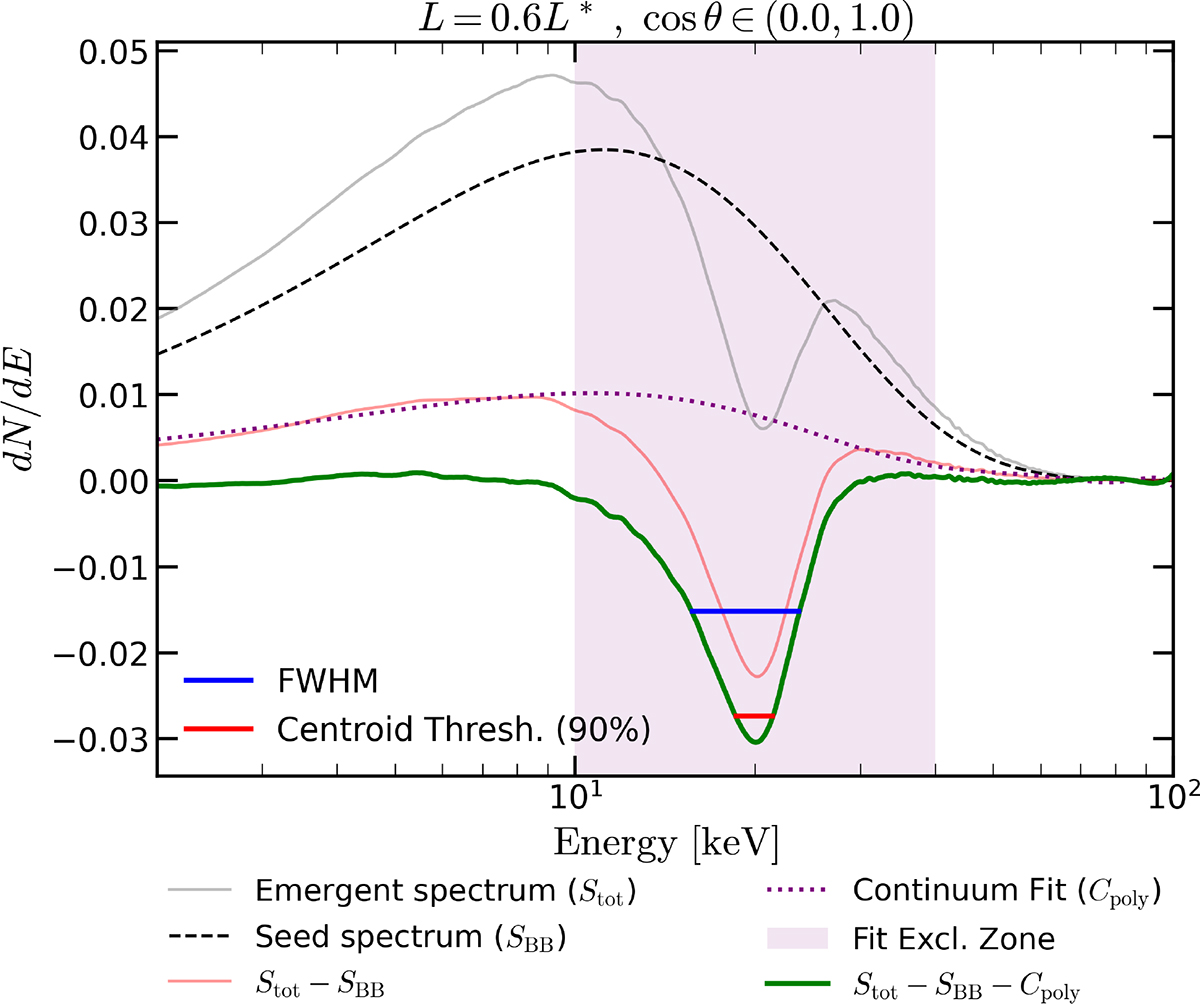
Illustration of the procedure used to measure the line parameters for a run with L = 0.6L*. Stot is the total spectrum in gray, SBB is the seed blackbody continuum in dashed black, Stot − SBB is the residual spectrum in red, and Cpoly is the sixth-order polynomial fit of the residual continuum spectrum, excluding the interval around the CRSF (pink shaded region). We measured the line width from the isolated absorption feature (Stot − SBB − Cpoly); green curve) as the FWHM (blue segment). Likewise, we estimated the centroid energy as the flux-weighted average energy within the region around the minimum where the absorption depth is larger than 90% of the maximum depth (red segment).
Current usage metrics show cumulative count of Article Views (full-text article views including HTML views, PDF and ePub downloads, according to the available data) and Abstracts Views on Vision4Press platform.
Data correspond to usage on the plateform after 2015. The current usage metrics is available 48-96 hours after online publication and is updated daily on week days.
Initial download of the metrics may take a while.