Fig. E.2.
Download original image
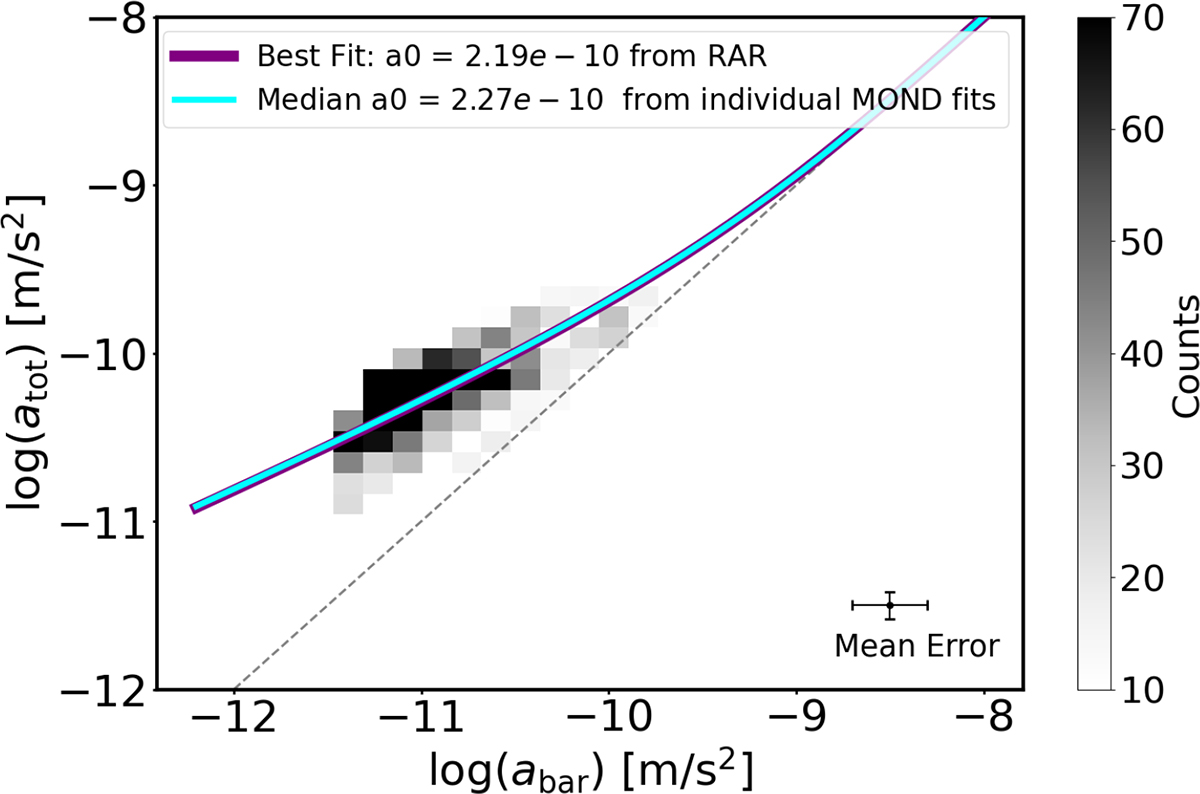
RAR of our intermediate-z sample, where abar and atot are derived from the RCs modelled in the MOND framework. The cross in the lower right corner indicates the mean 1σ uncertainties on the data points. The dotted black line shows the 1:1 relation. The purple curve represents the best-fit RAR, with ![]() (i.e. as in Fig. 1). The cyan curve shows the relation, as inferred using the median a0 value from the MOND fits to the individual data cubes, namely a0|z ∼ 1 = 2.27 × 10⁻¹⁰ m/s2.
(i.e. as in Fig. 1). The cyan curve shows the relation, as inferred using the median a0 value from the MOND fits to the individual data cubes, namely a0|z ∼ 1 = 2.27 × 10⁻¹⁰ m/s2.
Current usage metrics show cumulative count of Article Views (full-text article views including HTML views, PDF and ePub downloads, according to the available data) and Abstracts Views on Vision4Press platform.
Data correspond to usage on the plateform after 2015. The current usage metrics is available 48-96 hours after online publication and is updated daily on week days.
Initial download of the metrics may take a while.