Open Access
Fig. E.1.
Download original image
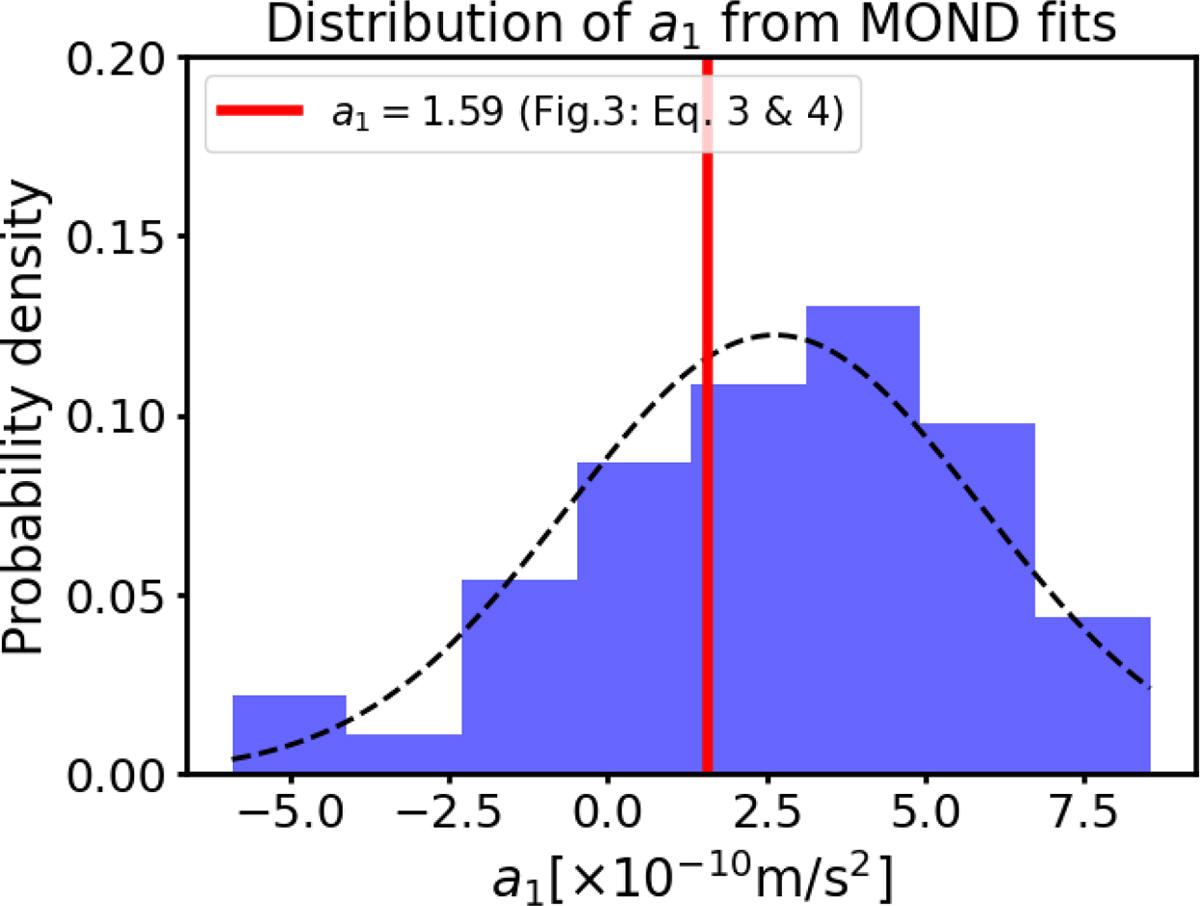
Distribution of the MOND acceleration parameter a1. The purple histogram shows the recovered a1 values from individual galaxy fits. The vertical red line marks the reference value obtained from the RAR in the main text, ![]() , using the DC14 framework (Eq. 4).
, using the DC14 framework (Eq. 4).
Current usage metrics show cumulative count of Article Views (full-text article views including HTML views, PDF and ePub downloads, according to the available data) and Abstracts Views on Vision4Press platform.
Data correspond to usage on the plateform after 2015. The current usage metrics is available 48-96 hours after online publication and is updated daily on week days.
Initial download of the metrics may take a while.