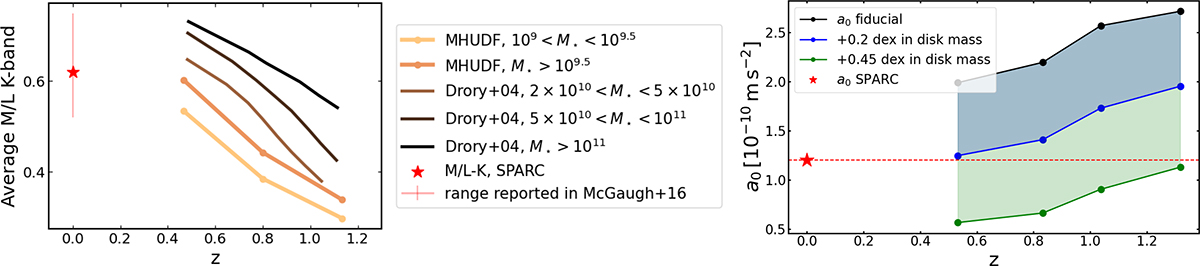
Fig. C.1.
Download original image
Left: Average mass-to-light ratios (M/L) in the K-band as a function of redshift for the MHUDF sample split into two M★ bins, the low-M★ bin (yellow) and high-M★ bin (orange), along with the evolution inferred for a sample of more than 5000 K-selected galaxies in Drory et al. (2004). The red star shows the M/L-K ratio adopted for the SPARC sample. Right: Impact of systematic disk mass offsets on the inferred a0(z). The black points correspond to the fiducial fits shown in Fig 3. The blue points show the inferred a0(z) assuming a global shift of +0.2 dex in the mass budget of the sample, while the green points show the same, but when assuming a global shift of +0.45 dex . The red star and dotted lines show the canonical a0(z = 0) inferred for the SPARC sample.
Current usage metrics show cumulative count of Article Views (full-text article views including HTML views, PDF and ePub downloads, according to the available data) and Abstracts Views on Vision4Press platform.
Data correspond to usage on the plateform after 2015. The current usage metrics is available 48-96 hours after online publication and is updated daily on week days.
Initial download of the metrics may take a while.