Fig. A.1.
Download original image
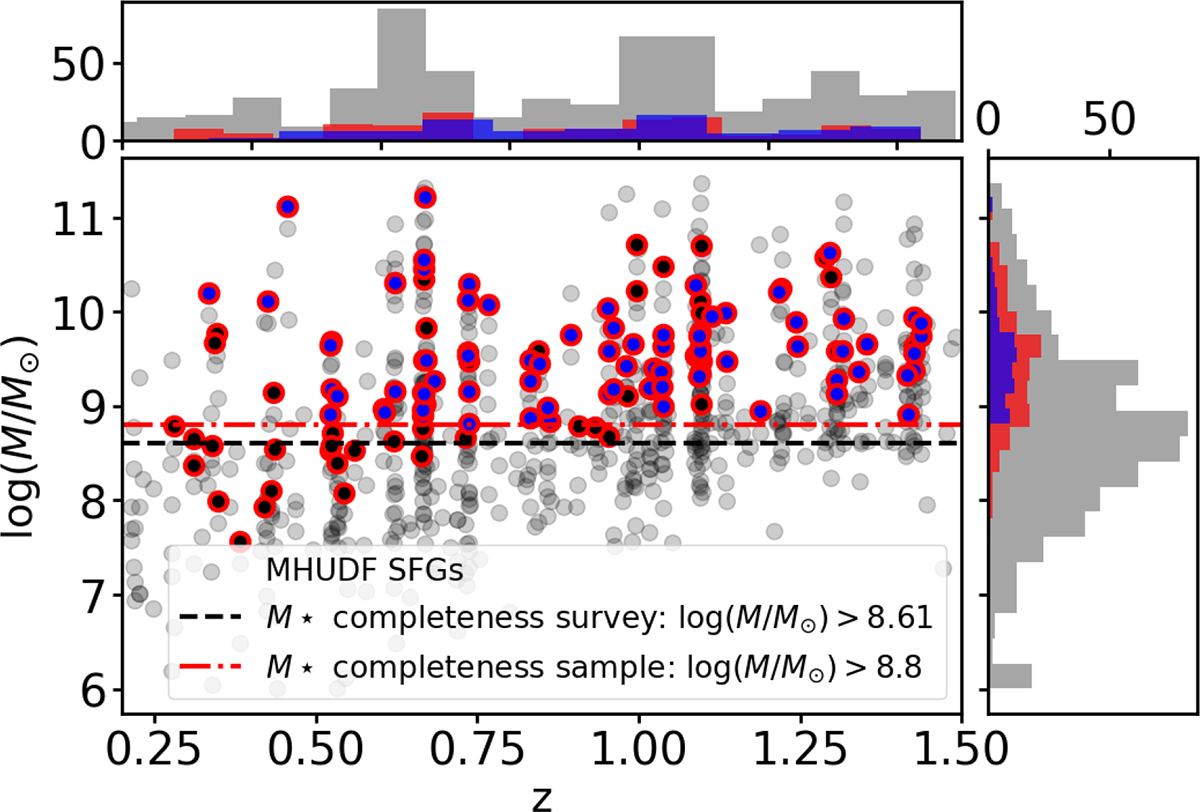
Stellar masses vs redshift for all MHUDF SFGs. The dashed black line indicates the mass completeness limit of the survey, which is reasonably complete for 0.2 < z < 1.5 down to log(M★/M⊙) = 8.6. The dashed red line shows the completeness of the parent sample from Paper I. The grey points show all SFGs observed in the MHUDF survey, the red-outlined points correspond to the galaxies analysed in Paper I, and the blue points indicate the galaxies studied in this work. The histograms on the top and right display the redshift and stellar-mass distributions, respectively, colour-coded to match the main panel.
Current usage metrics show cumulative count of Article Views (full-text article views including HTML views, PDF and ePub downloads, according to the available data) and Abstracts Views on Vision4Press platform.
Data correspond to usage on the plateform after 2015. The current usage metrics is available 48-96 hours after online publication and is updated daily on week days.
Initial download of the metrics may take a while.