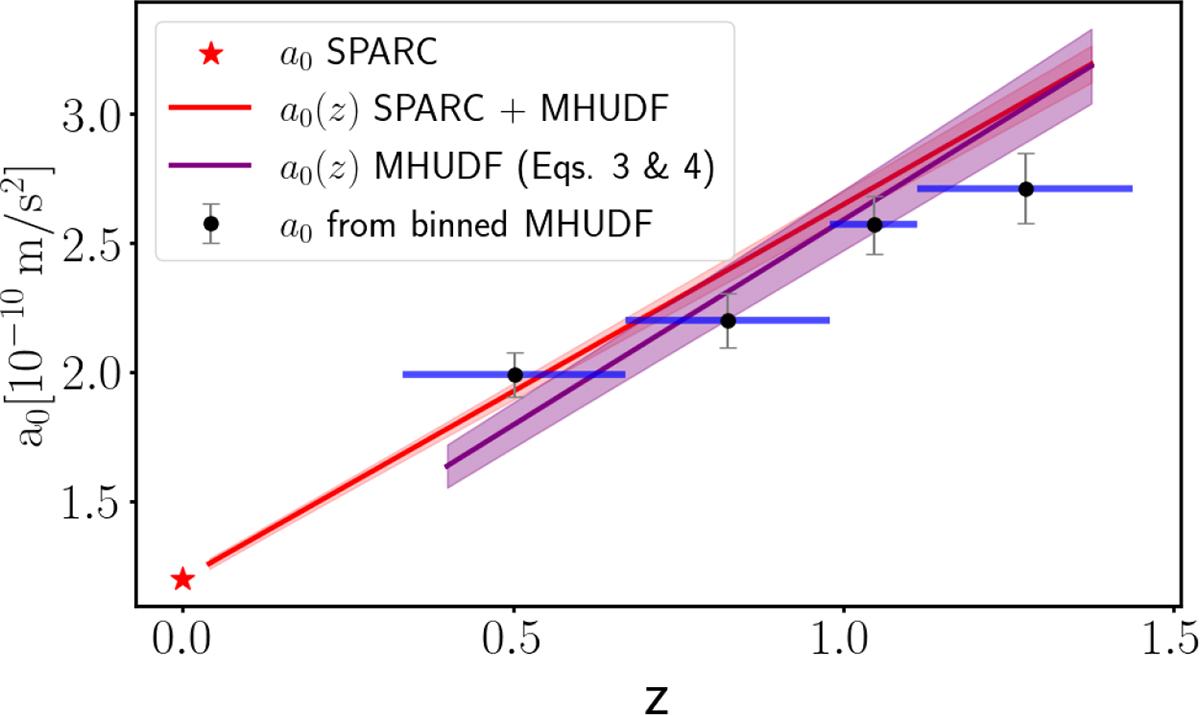
Fig. 3.
Download original image
Redshift evolution of the characteristic acceleration scale. In each quantile-based z bin (blue bars), we fit the RAR with Eq. (1) to derive a0, with uncertainties shown as grey error bars. The star marks the SPARC z = 0 value. The purple line shows the predicted evolution, using the best-fitting parameters from the global z-dependent fit to the RAR for the full sample (i.e. using Eq. (1) where a0 was substituted with Eq. (3); see Eq. (4)). The red line shows the same, but including SPARC in the fit. The coloured shaded region shows the 1σ errors for the fits.
Current usage metrics show cumulative count of Article Views (full-text article views including HTML views, PDF and ePub downloads, according to the available data) and Abstracts Views on Vision4Press platform.
Data correspond to usage on the plateform after 2015. The current usage metrics is available 48-96 hours after online publication and is updated daily on week days.
Initial download of the metrics may take a while.