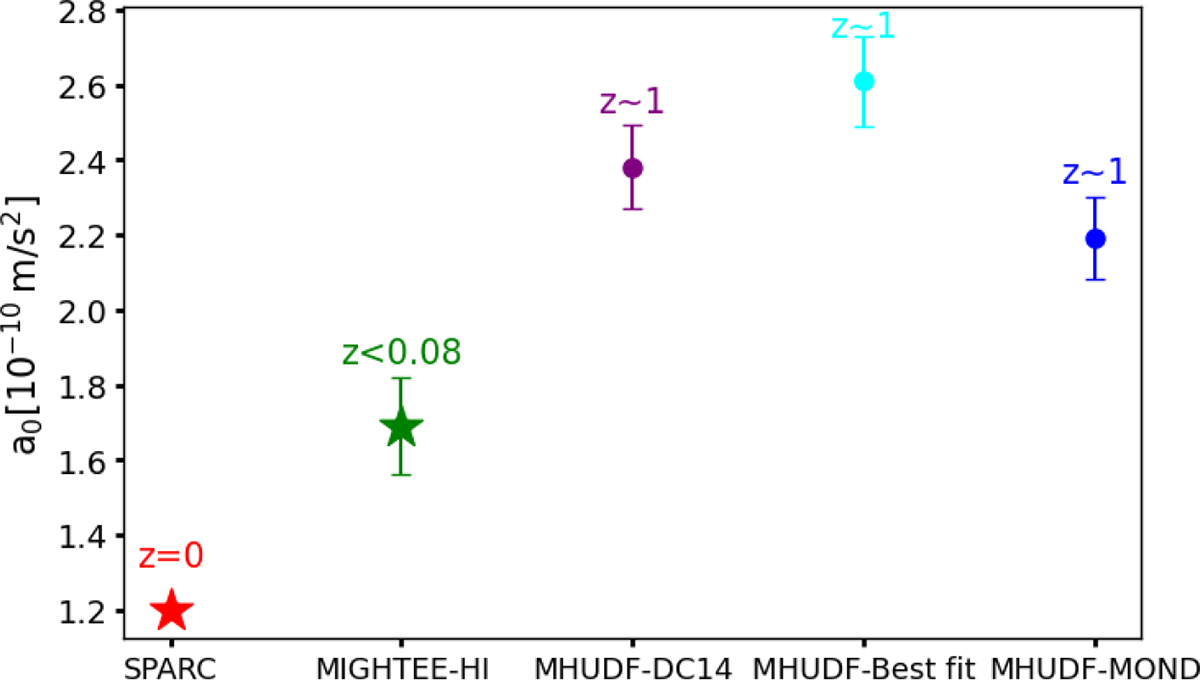
Fig. 2.
Download original image
Best-fit a0 values obtained by fitting Eq. (1) on the full sample, using the resolved RAR tracks derived under different modelling assumptions. The purple data point shows a0|z ∼ 1 obtained using the DC14 halo profile applied uniformly to the full sample (Sect. 3.1). The cyan point shows a0|z ∼ 1 derived from a galaxy-by-galaxy best-fitting ΛCDM model, where each galaxy is assigned the DM profile that maximises its Bayesian evidence (Appendix D). The blue point shows a0|z ∼ 1 recovered from the MOND-based framework (Appendix E). The red star indicates the fiducial a0|z ∼ 0 from McGaugh et al. (2016), while the green star shows the result from Vărăşteanu et al. (2025).
Current usage metrics show cumulative count of Article Views (full-text article views including HTML views, PDF and ePub downloads, according to the available data) and Abstracts Views on Vision4Press platform.
Data correspond to usage on the plateform after 2015. The current usage metrics is available 48-96 hours after online publication and is updated daily on week days.
Initial download of the metrics may take a while.