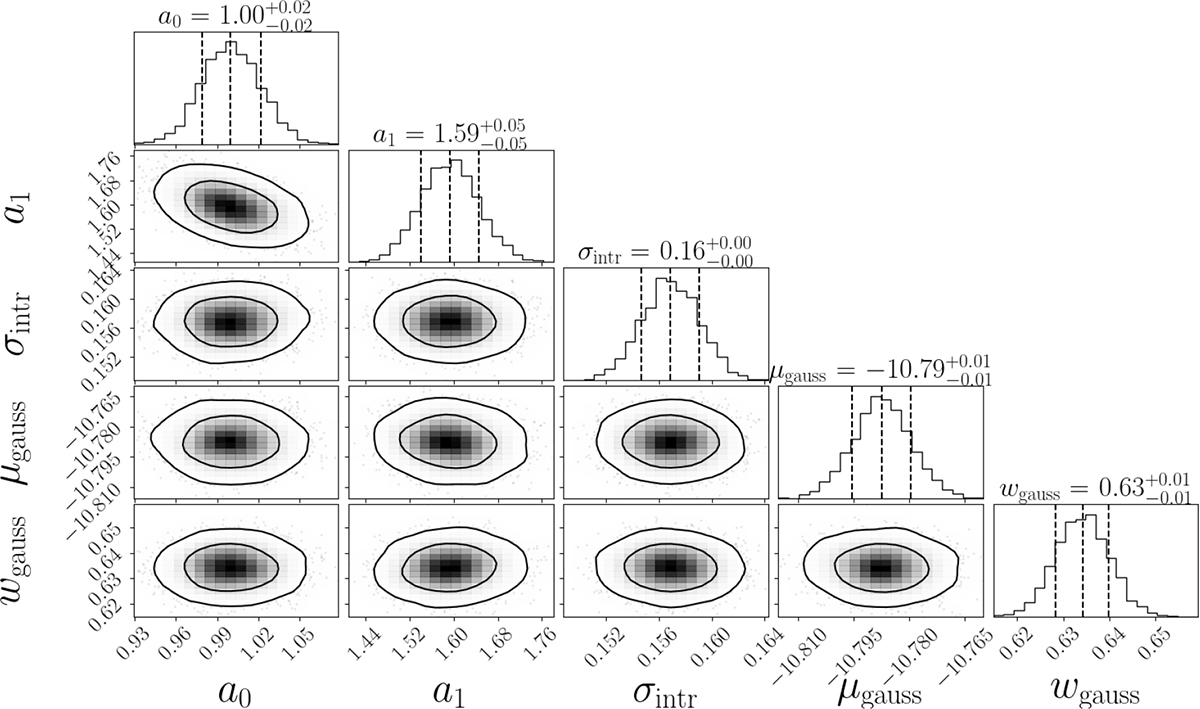
Fig. F.1.
Download original image
Corner plot showing the posterior distributions of the parameters from the redshift-dependent fit to the RAR for the full sample. The acceleration scale is replaced by a0(z) = a0(0)+a1 ⋅ z in the MOND-inspired interpolation function (Eq. 1). The Gaussian hyperparameters μgauss and wgauss define the mean and width of the Gaussian prior on the true log(abar) values, as implemented in Roxy, while σintr represents the intrinsic scatter of the RAR. The units of a0 and a1 are 10−10 m/s2, while for μgauss, wgauss, and σintr the units are in dex. The contours indicate the 68% and 95% confidence levels.
Current usage metrics show cumulative count of Article Views (full-text article views including HTML views, PDF and ePub downloads, according to the available data) and Abstracts Views on Vision4Press platform.
Data correspond to usage on the plateform after 2015. The current usage metrics is available 48-96 hours after online publication and is updated daily on week days.
Initial download of the metrics may take a while.