Fig. 1.
Download original image
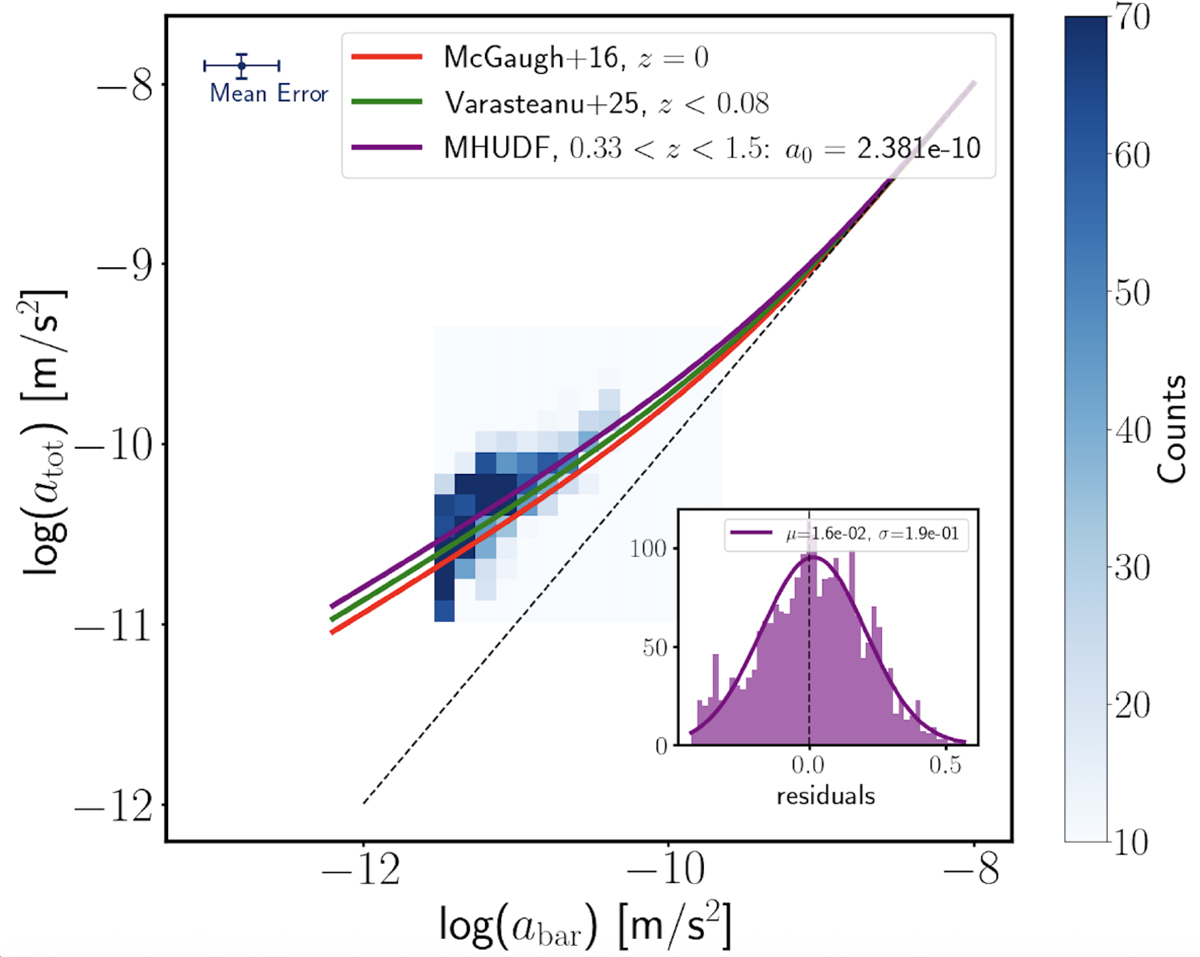
RAR for the MHUDF sample. The purple curve shows the best-fit RAR at 0.33 < z < 1.44 using Eq. (1), while the red and green curves show the McGaugh et al. (2016) relation at z = 0 and the Vărăşteanu et al. (2025) relation at z < 0.08, respectively. The black dotted line indicates the 1:1 relation. The histogram in the inset displays the residuals with respect to our fit. The cross in the upper left corner indicates the mean 1σ uncertainties.
Current usage metrics show cumulative count of Article Views (full-text article views including HTML views, PDF and ePub downloads, according to the available data) and Abstracts Views on Vision4Press platform.
Data correspond to usage on the plateform after 2015. The current usage metrics is available 48-96 hours after online publication and is updated daily on week days.
Initial download of the metrics may take a while.