


Fig. B.1.
Download original image
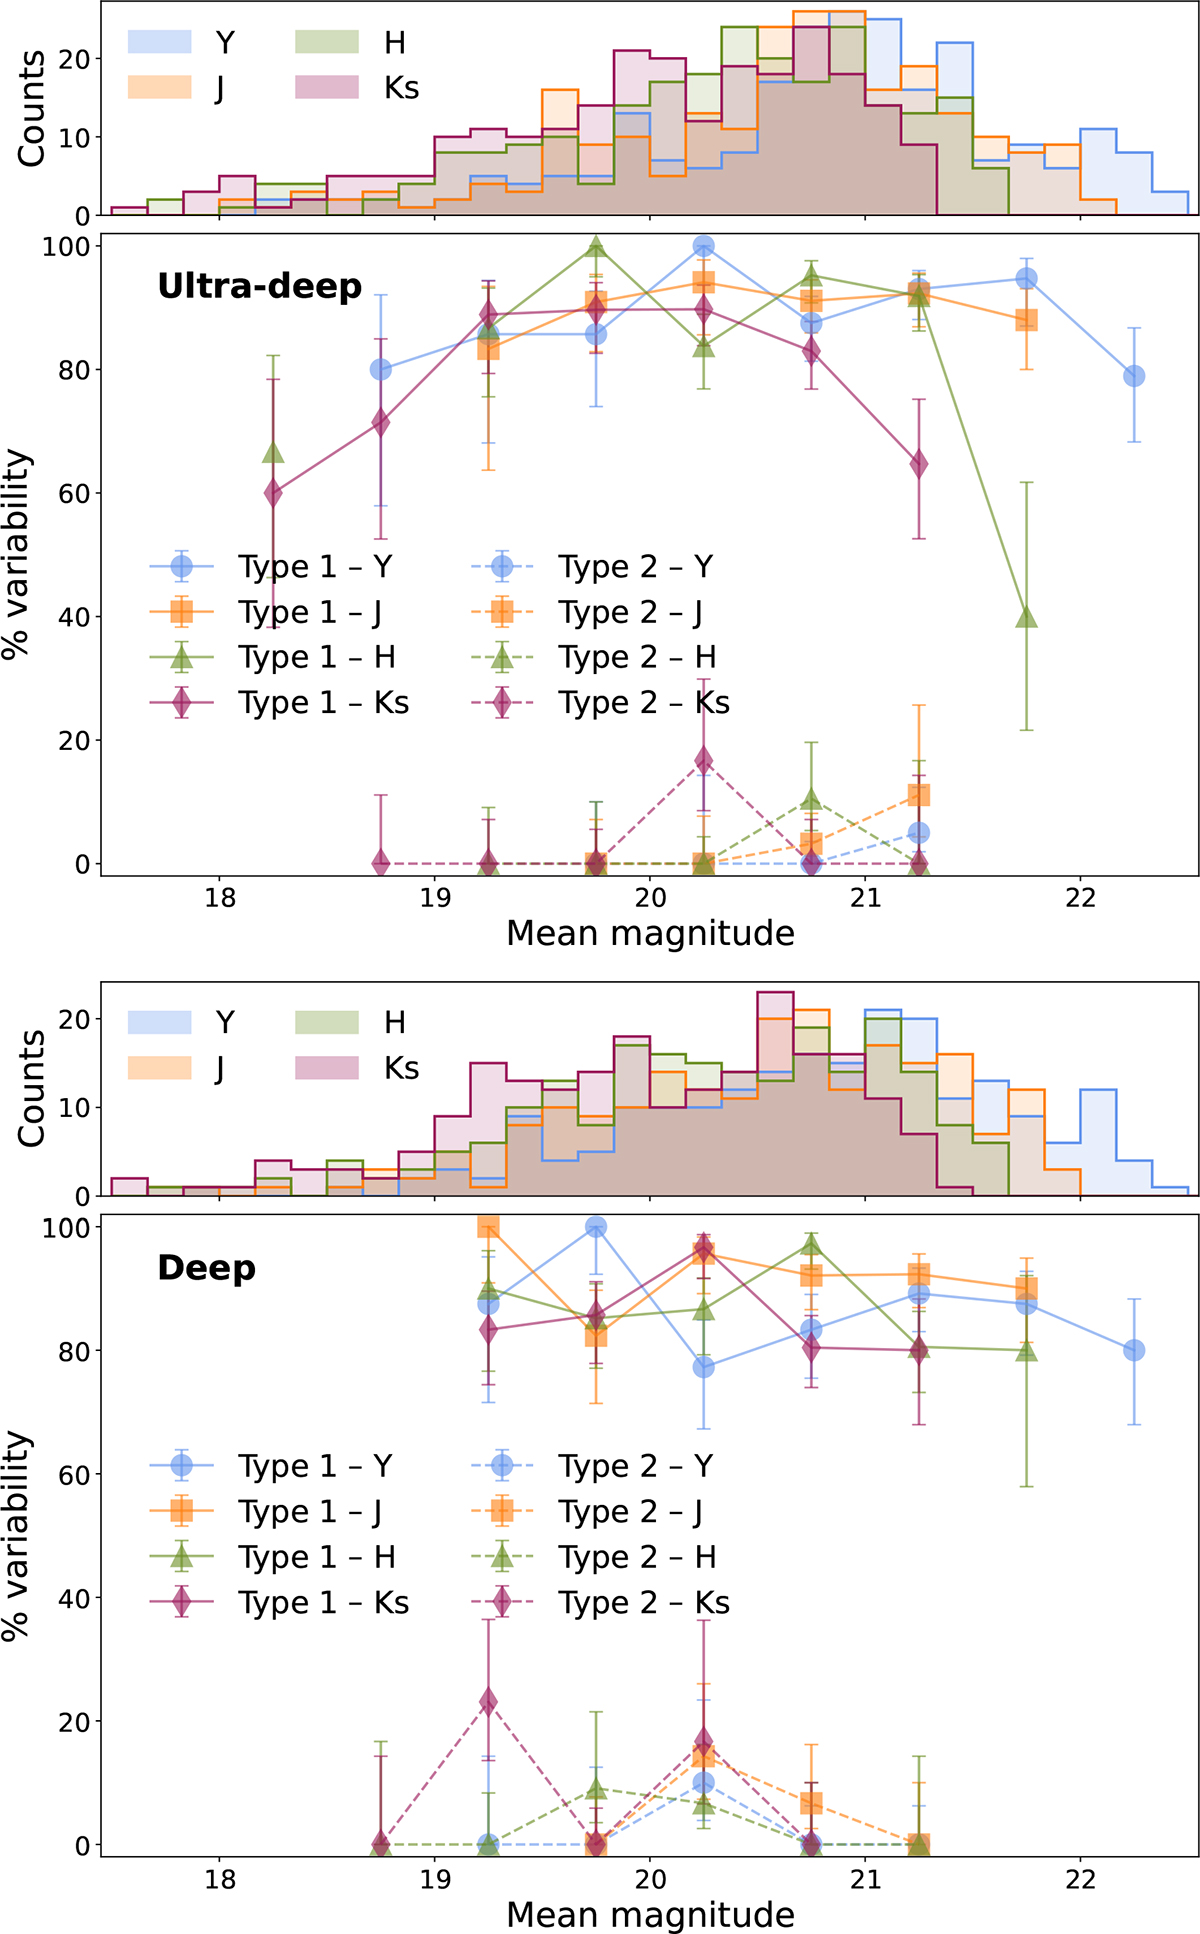
Fraction of variable sources as a function of observed magnitude in each NIR band (YJHKs). The top panel corresponds to the ultra-deep stripes and the bottom panel to the deep stripes. In both cases, the upper subpanels show the magnitude distribution in the four bands. The lower subpanels display the variability fraction in each band, where different markers indicate the NIR bands (circles: Y, squares: J, triangles: H, diamonds: Ks), and solid and dashed lines distinguish type 1 and type 2 AGNs, respectively. Error bars represent the 1σ Wilson confidence intervals for each bin.
Current usage metrics show cumulative count of Article Views (full-text article views including HTML views, PDF and ePub downloads, according to the available data) and Abstracts Views on Vision4Press platform.
Data correspond to usage on the plateform after 2015. The current usage metrics is available 48-96 hours after online publication and is updated daily on week days.
Initial download of the metrics may take a while.