


Fig. 10.
Download original image
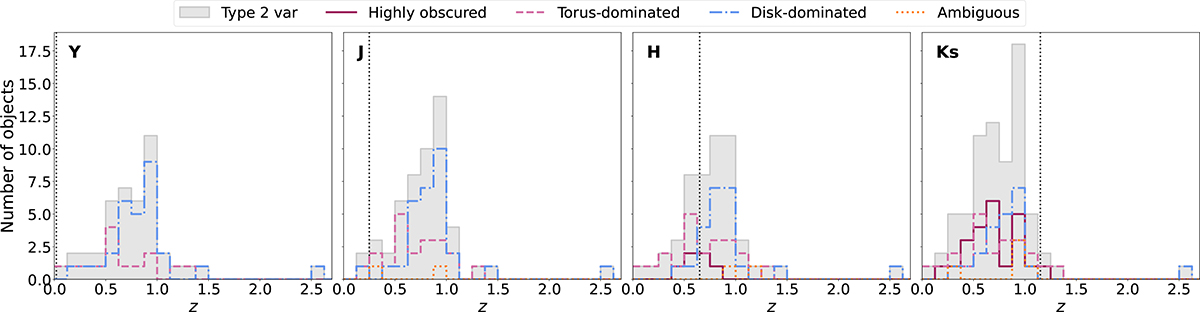
Redshift distribution of variable type 2 AGNs. The gray shaded area represents all variable type 2 AGN sources. Solid lines correspond to highly obscured sources, dashed lines to torus-dominated source, dash–dotted lines to disk-dominated sources, and dotted lines to ambiguous cases. Vertical dotted lines mark the redshift at which each observed NIR band corresponds to a rest-frame wavelength of 1 μm, marking the transition between accretion disk and dusty torus emission.
Current usage metrics show cumulative count of Article Views (full-text article views including HTML views, PDF and ePub downloads, according to the available data) and Abstracts Views on Vision4Press platform.
Data correspond to usage on the plateform after 2015. The current usage metrics is available 48-96 hours after online publication and is updated daily on week days.
Initial download of the metrics may take a while.