Fig. 4.
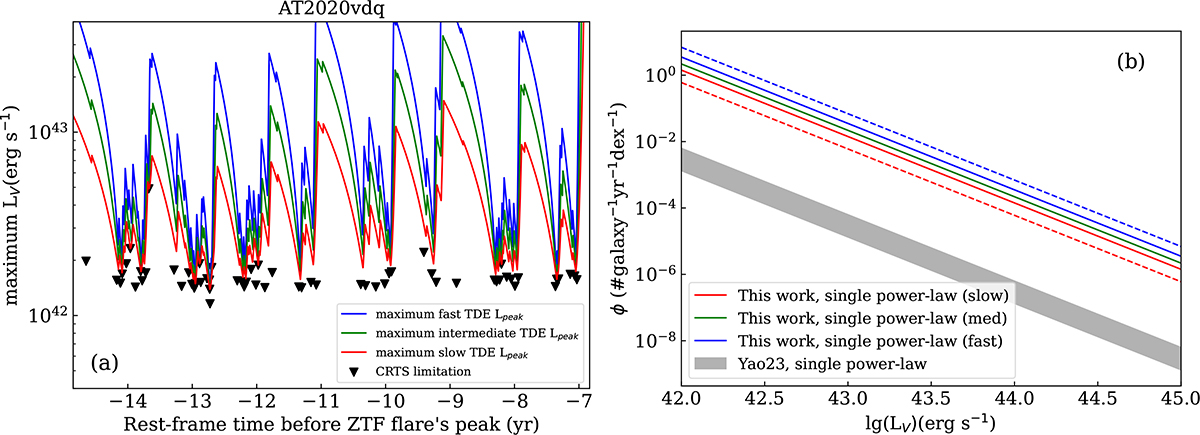
Download original image
(a): Same example as Figure 3(a), but for TDEs. (b): Luminosity function (LF) of TDEs in our sample, with EMD calculated assuming different timescales (blue, green, and red for fast, intermediate and slow types, respectively). Best estimates are shown as solid lines, while the 1σ upper limit for the fast type and the 1σ lower limit for the slow type are shown as dashed lines. The TDE LF from Yao23 is shown as a shaded grey region for comparison.
Current usage metrics show cumulative count of Article Views (full-text article views including HTML views, PDF and ePub downloads, according to the available data) and Abstracts Views on Vision4Press platform.
Data correspond to usage on the plateform after 2015. The current usage metrics is available 48-96 hours after online publication and is updated daily on week days.
Initial download of the metrics may take a while.