Fig. 3.
Download original image
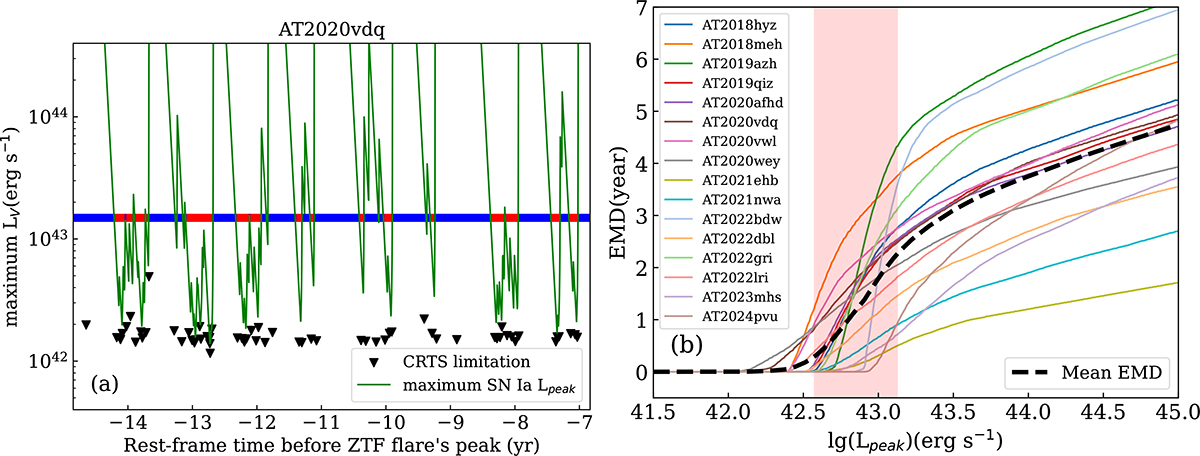
(a): Example using AT 2020vdq to illustrate the calculation of the effective monitoring duration (EMD). Black triangles show the 5σ upper-limit of the CRTS data points, and the green line indicates the maximum LV allowed by the observations as a function of tpeak. Observational time are converted to the phase before the ZTF TDE in the rest-frame. For a given LV (example shown for LV ∼ 1043.14 erg/s, corresponding to MV ∼ −19.4), the time ranges when the maximum allowed LV is below this luminosity (red) are considered effectively monitored, while other times (blue) are not. (b): Resultant EMDs as functions of peak LV for the sample. The dashed black line indicates the average EMD, and the red shaded region marks the typical Lpeak range of SN Ia (−18 < MV < −19.4).
Current usage metrics show cumulative count of Article Views (full-text article views including HTML views, PDF and ePub downloads, according to the available data) and Abstracts Views on Vision4Press platform.
Data correspond to usage on the plateform after 2015. The current usage metrics is available 48-96 hours after online publication and is updated daily on week days.
Initial download of the metrics may take a while.